Fig. 4
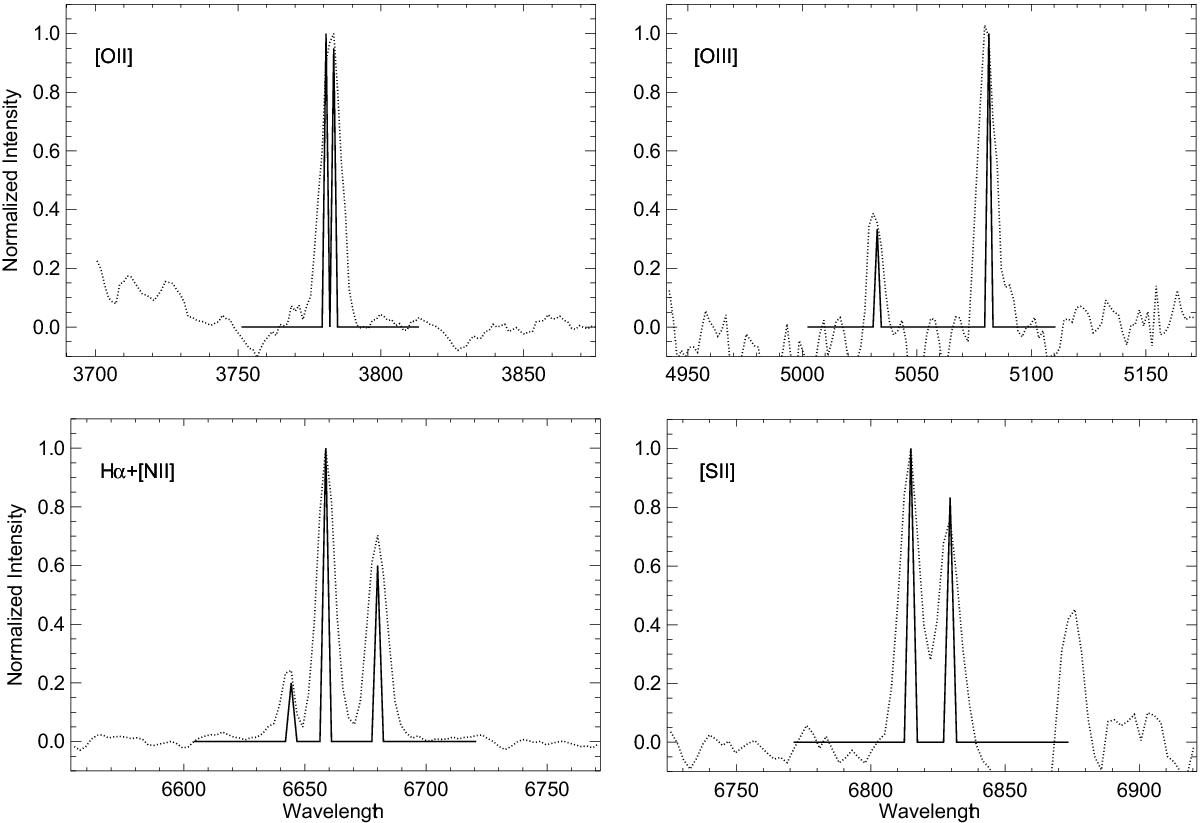
Templates (solid line) generated including the appropiate number of Gaussians to simulate the emission lines in the four spectral ranges selected to apply the CC technique. For each galaxy Gaussians are centered at the corresponding wavelength according to their redshift in NED. Intensity ratio between emission lines were fixed according to atomic parameters. For those intensities unlinked to other lines, we checked the typical ratios across the objects (see text and Table 1). Dotted lines correspond to the central spectrum of NGC 2347.
Current usage metrics show cumulative count of Article Views (full-text article views including HTML views, PDF and ePub downloads, according to the available data) and Abstracts Views on Vision4Press platform.
Data correspond to usage on the plateform after 2015. The current usage metrics is available 48-96 hours after online publication and is updated daily on week days.
Initial download of the metrics may take a while.