Free Access
Fig. 3
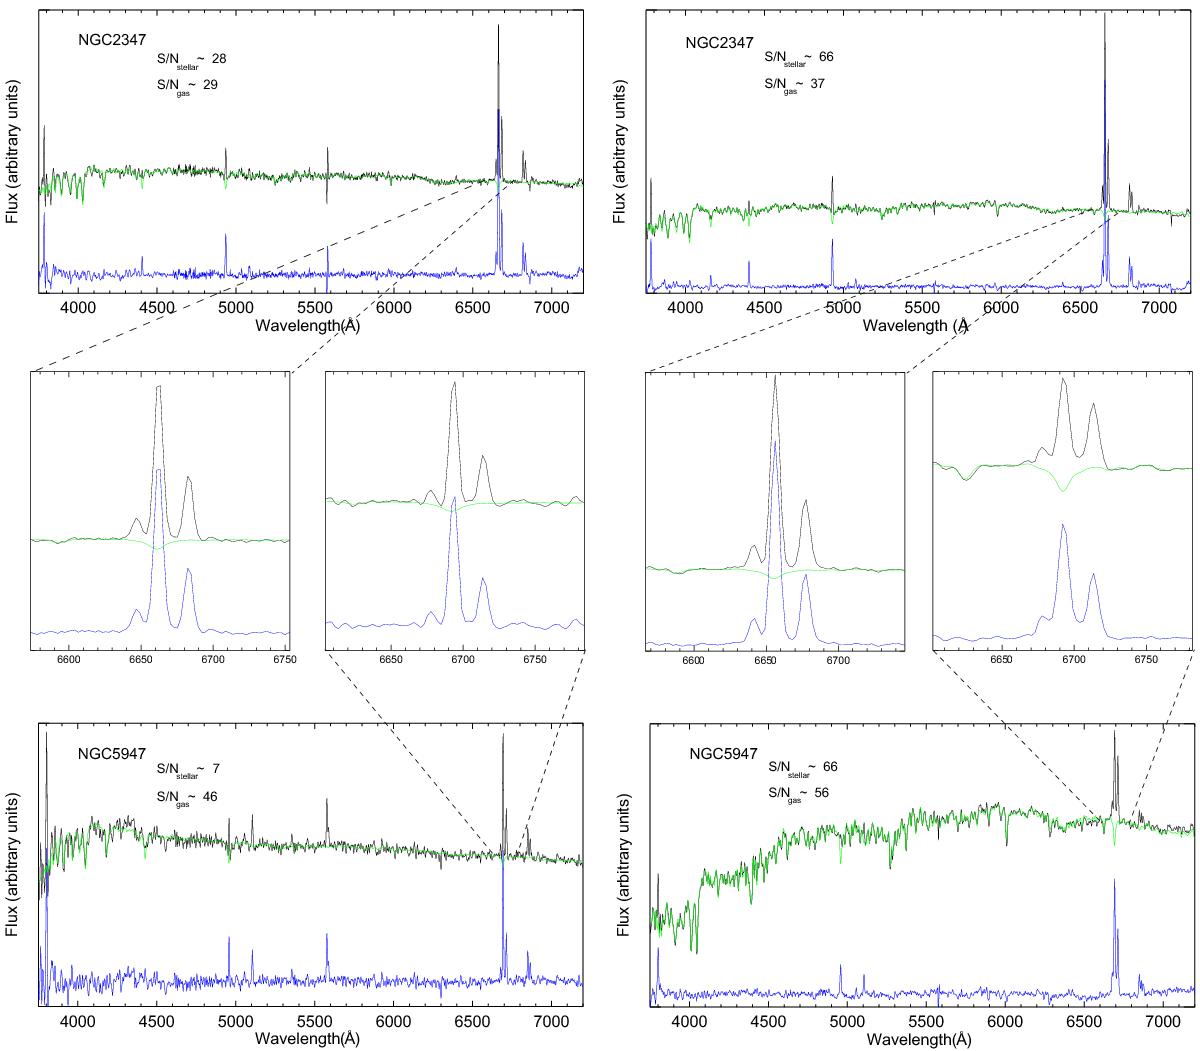
Spectra of different S/N (in the stellar continuum and ionized gas) of NGC 2347 and NGC 5947 in the full spectral range (top and botton panels) and in a range around Hα+[NII]. Black spectra correspond to the data and green to the bestfit stellar continuum. Residual spectra, including emission lines, are in blue.
Current usage metrics show cumulative count of Article Views (full-text article views including HTML views, PDF and ePub downloads, according to the available data) and Abstracts Views on Vision4Press platform.
Data correspond to usage on the plateform after 2015. The current usage metrics is available 48-96 hours after online publication and is updated daily on week days.
Initial download of the metrics may take a while.