Fig. 2
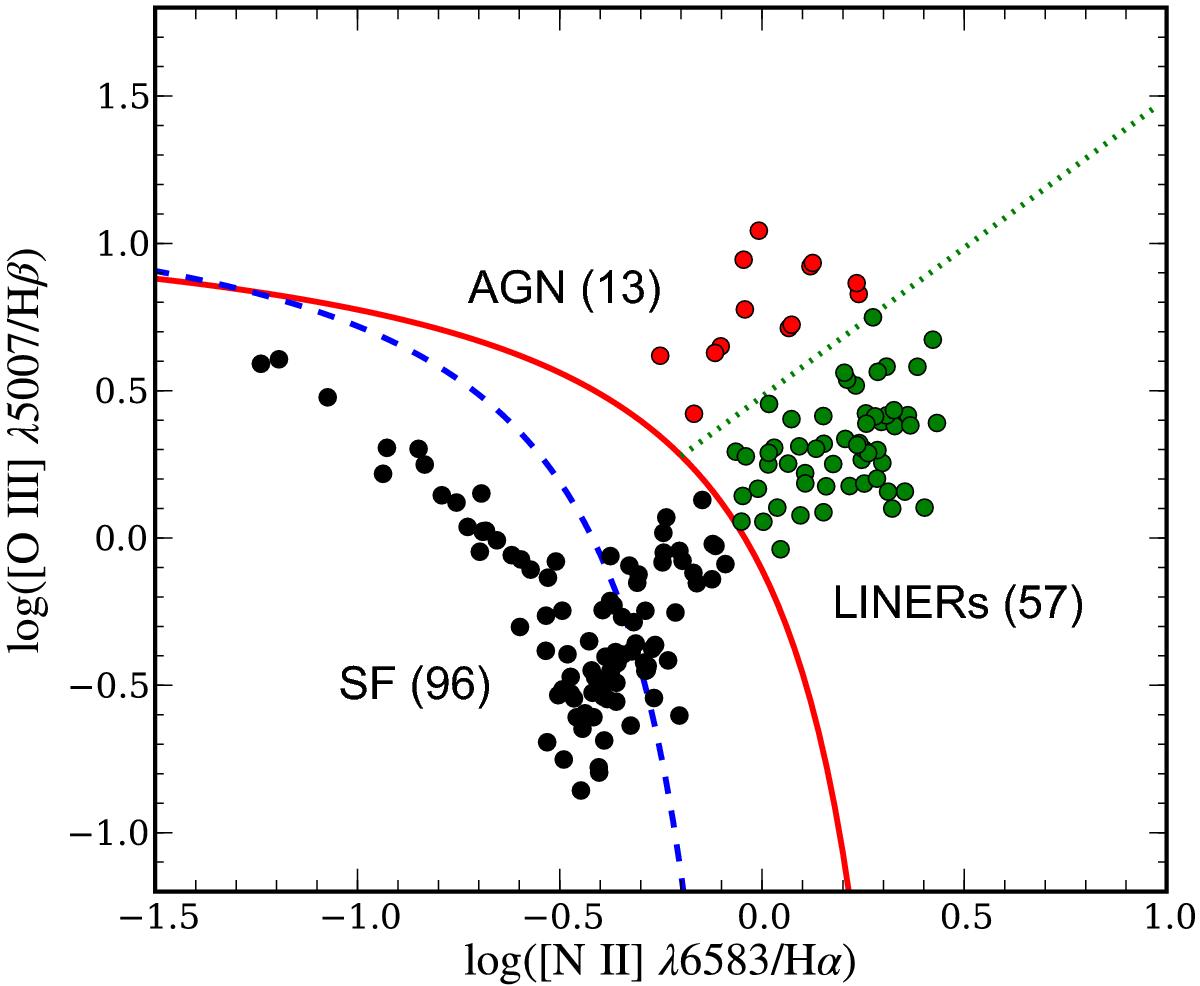
Emission-line diagnostic diagram for the optical nucleus spectrum of each galaxy in the sample. Only objects for which all required emission lines have signal-to-noise larger than three are shown (166 galaxies). The demarcation lines of Kewley et al. (2001) (red curve), Kauffmann et al. (2003) (dashed-blue curve), and Cid Fernandes et al. (2010) (dotted-green straight line) are used to classify the galaxies into star forming (SF), active galactic nuclei (AGN), and LINER-type galaxies, which are denoted with black, red, and green symbols, respectively.
Current usage metrics show cumulative count of Article Views (full-text article views including HTML views, PDF and ePub downloads, according to the available data) and Abstracts Views on Vision4Press platform.
Data correspond to usage on the plateform after 2015. The current usage metrics is available 48-96 hours after online publication and is updated daily on week days.
Initial download of the metrics may take a while.