Fig. B.3
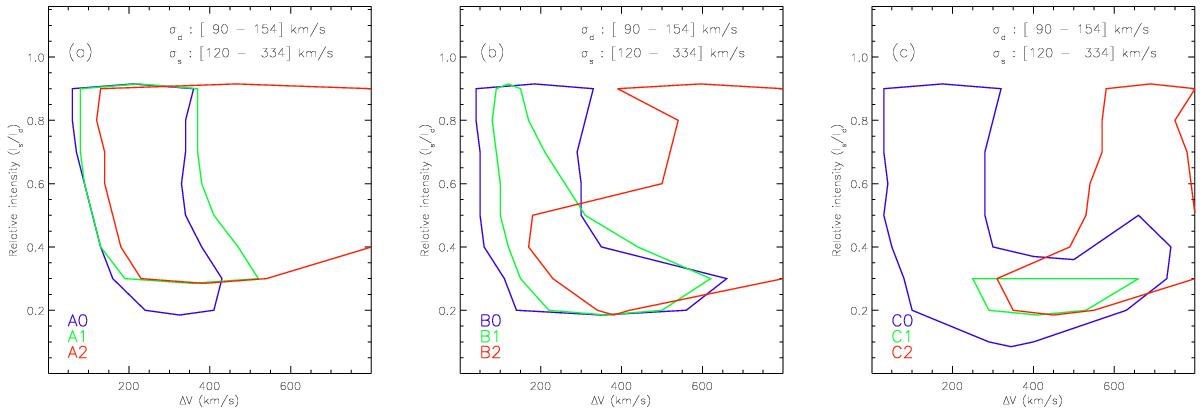
Examples of the parameter space for two Gaussians combined to model asymmetric emission line profiles of the types and classes defined in this work (see Sect. 4.2). Lines encicle the region of possible values of the | ΔV | and Is/Id parameters resulting in an asymmetric profile of the classes a) A0, A1, and A2, b) B0, B1, and B2, and c) C0, C1, and C2 indicated by colors. Each plot includes the velocity dispersion ranges for the secondary (σs ~ [120 − 334] km s-1) and dominant (σs ~ [90 − 154] km s-1) components used to model the profiles.
Current usage metrics show cumulative count of Article Views (full-text article views including HTML views, PDF and ePub downloads, according to the available data) and Abstracts Views on Vision4Press platform.
Data correspond to usage on the plateform after 2015. The current usage metrics is available 48-96 hours after online publication and is updated daily on week days.
Initial download of the metrics may take a while.