Fig. B.1
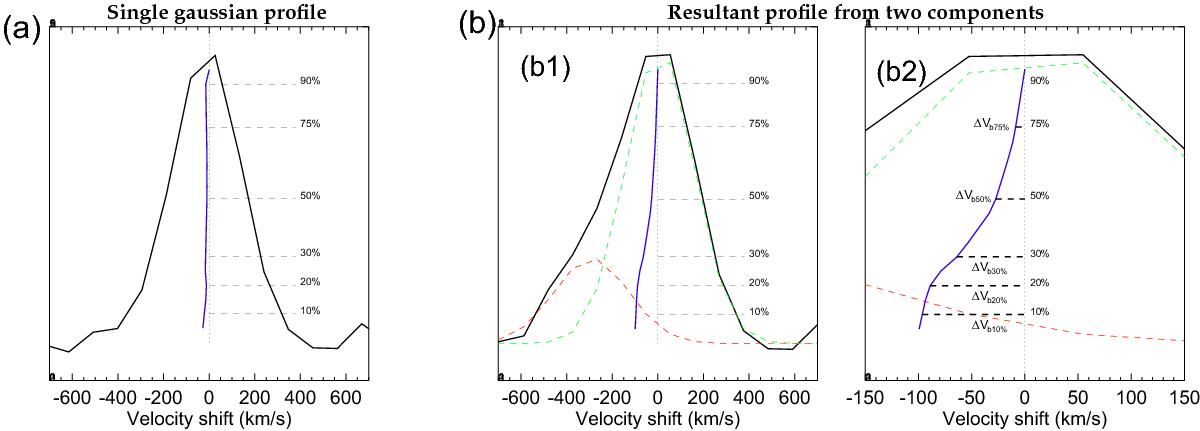
a) Single-Gaussian model (including random noise) of an single emission line (S/N ~ 45) for CALIFA V500. The bisector of a symmetric profile should remain at constant velocity (or wavelength) for all intensity levels, dividing it into two equal parts; any existing asymmetry between the base and the peak of the line will remain reflected in the shape of the bisector. The dotted vertical line corresponds to the bisector of an ideal symmetric Gaussian profile, while the blue line is the actual bisector of the modeled profile, which deviates from the ideal bisector due to noise and velocity sampling. Dashed lines only indicate some intensity levels (in percentage of the intensity peak) that are refered to as “bisector levels”. b), b1) Resultant profile (black line) from the combination of two Gaussian components. Both Gaussians profiles have similar velocity dispersions, a flux ratio of 0.3 and a velocity shift of 300 km s-1 (red and green dashed curves). The blue line is the bisector of the resultant profile and the dotted vertical line is the same as in a). b), b2) Zoom of the profile in b1). Horizontal dashed lines indicate the difference in velocity between the central velocity (traced by the dotted line) and the velocity at different bisector levels (ΔVb).
Current usage metrics show cumulative count of Article Views (full-text article views including HTML views, PDF and ePub downloads, according to the available data) and Abstracts Views on Vision4Press platform.
Data correspond to usage on the plateform after 2015. The current usage metrics is available 48-96 hours after online publication and is updated daily on week days.
Initial download of the metrics may take a while.