Fig. 12
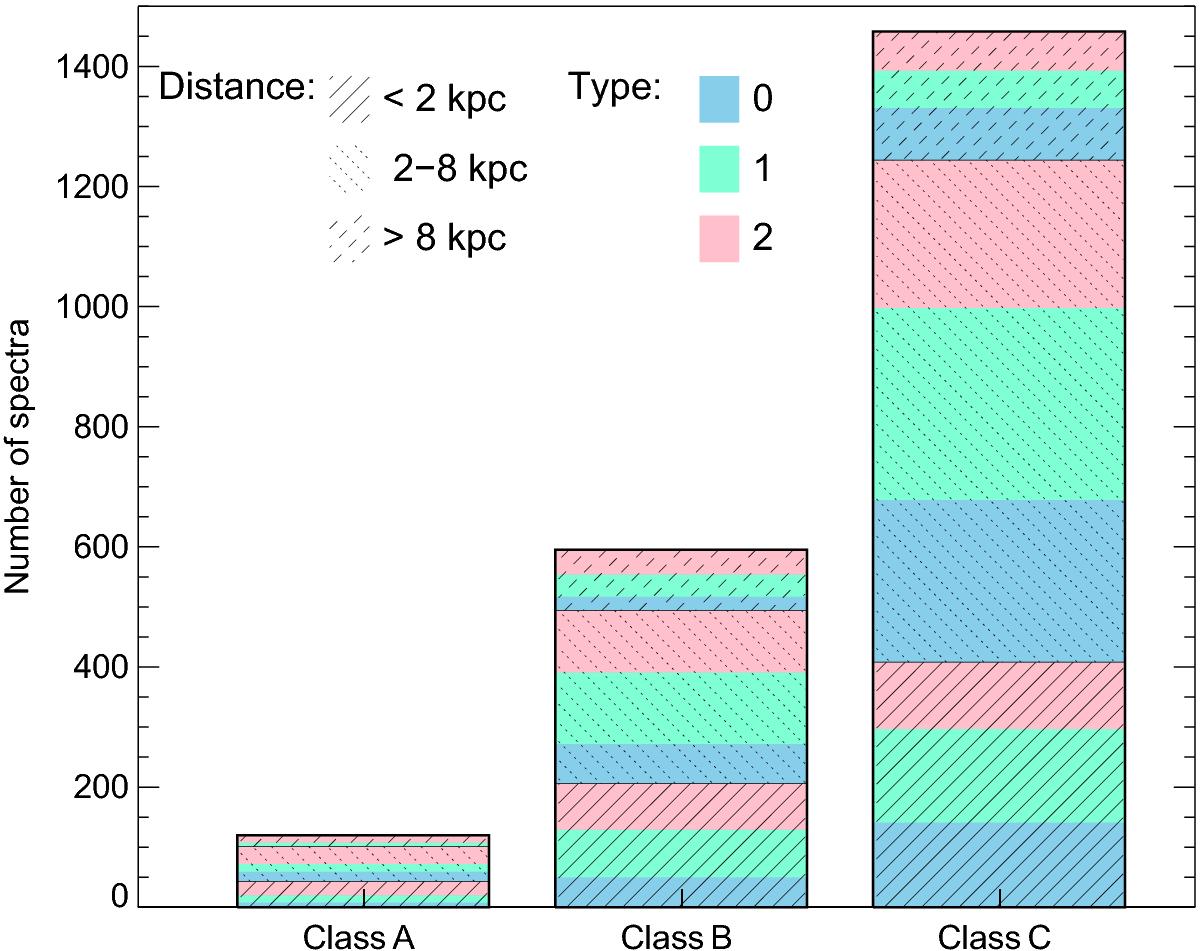
Distribution of asymmetries detected in the [O iii] profiles according to the classes defined. We indicate the fraction of spectra located at different distances from the galaxy center (as coded in the plot). Colors indicate the proportion of profiles with detected asymmetric types according to bisector deviation from a Gaussian (as coded in the plot) in each division.
Current usage metrics show cumulative count of Article Views (full-text article views including HTML views, PDF and ePub downloads, according to the available data) and Abstracts Views on Vision4Press platform.
Data correspond to usage on the plateform after 2015. The current usage metrics is available 48-96 hours after online publication and is updated daily on week days.
Initial download of the metrics may take a while.