Free Access
Fig. 3
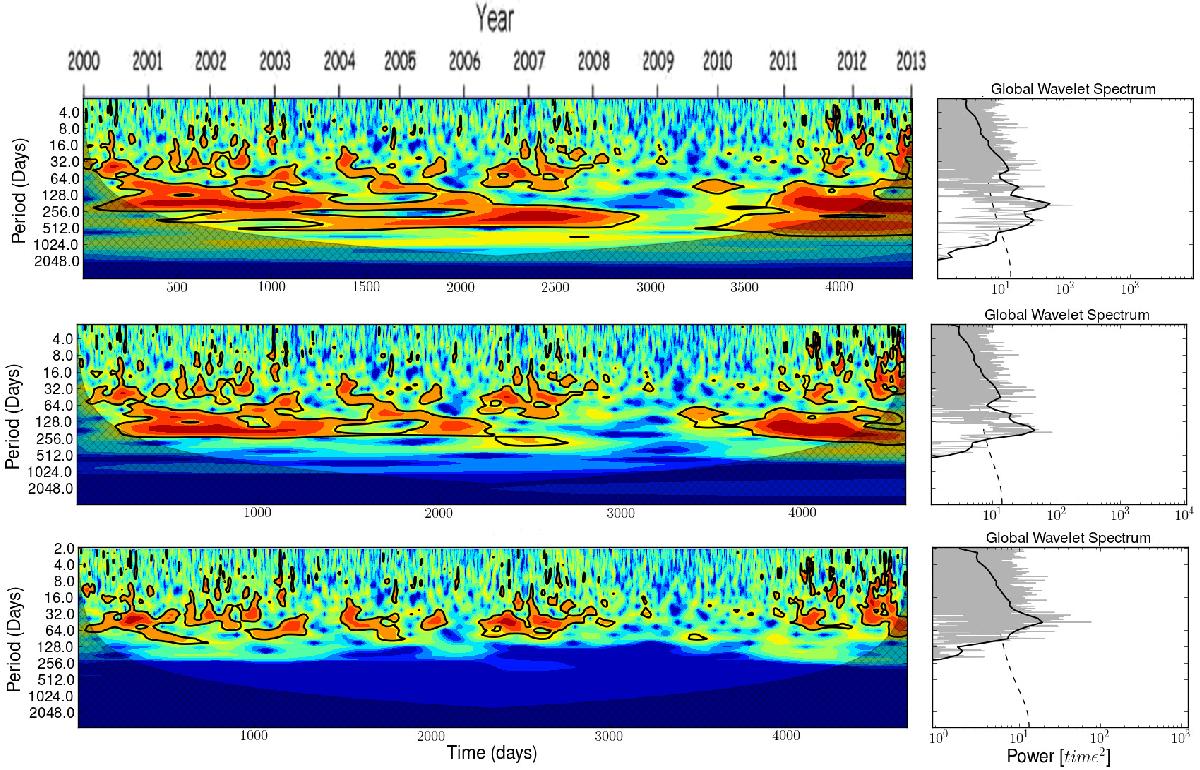
Top panel: wavelet power spectrum obtained by the application of CWT to the SMA smoothed (scale of 365 days) CME time series. Middle panel: the same, using a scale of 180 days. Bottom panel: the same, using a scale of 60 days. On the right, the corresponding GWSs are shown.
Current usage metrics show cumulative count of Article Views (full-text article views including HTML views, PDF and ePub downloads, according to the available data) and Abstracts Views on Vision4Press platform.
Data correspond to usage on the plateform after 2015. The current usage metrics is available 48-96 hours after online publication and is updated daily on week days.
Initial download of the metrics may take a while.