Fig. 2
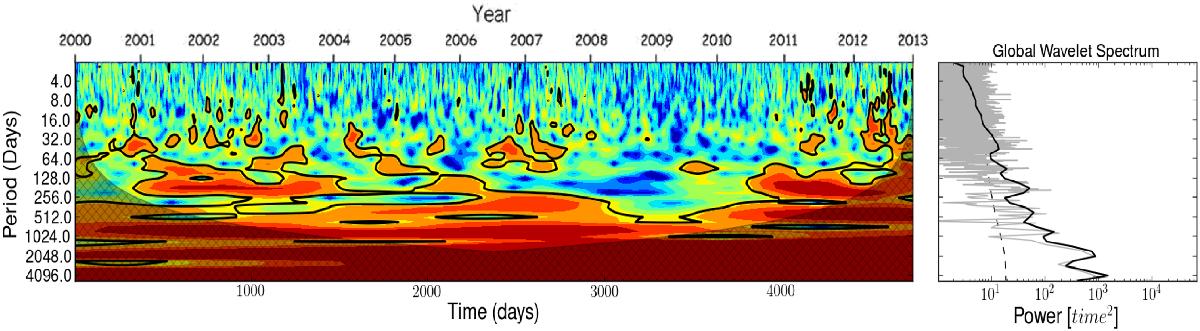
Wavelet power and global wavelet spectra obtained by the CWT applied to the original CME time series. Day of the series, from 01/01/2000 up to 12/31/2012 is at the horizontal axis. The days that appear in the x label are associated with years: day 1000 corresponds to 09/26/2002; day 2000 is 06/22/2005; day 3000 occurred on 03/18/2008 and finally, day 4000 corresponds to 12/13/2010. Vertical axis shows the full band (2–4096 days) of investigations. On the right, the corresponding GWS is shown.
Current usage metrics show cumulative count of Article Views (full-text article views including HTML views, PDF and ePub downloads, according to the available data) and Abstracts Views on Vision4Press platform.
Data correspond to usage on the plateform after 2015. The current usage metrics is available 48-96 hours after online publication and is updated daily on week days.
Initial download of the metrics may take a while.