Fig. 8
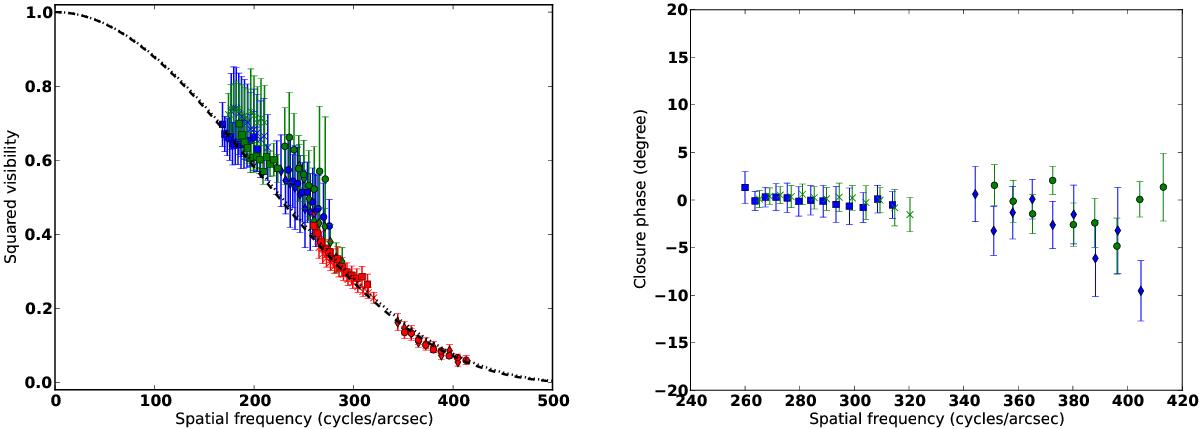
Left panel: calibrated squared visibilities of γ Psc. The colour denotes the baseline: K0-G1, A0-G1, and A0-K0 are shown in blue, green, and red, respectively. The dashed and dotted lines are the best-fit UD angular diameters in the H and K bands. Different symbols are used to represent the two calibrated exposures in the H (circles and diamonds) and K (squares and crosses) band. Right panel: closure phases as a function of the longest spatial frequency in the triplet. The same symbols are used as in the left panel, but the colour now denotes the exposure (blue being the first).
Current usage metrics show cumulative count of Article Views (full-text article views including HTML views, PDF and ePub downloads, according to the available data) and Abstracts Views on Vision4Press platform.
Data correspond to usage on the plateform after 2015. The current usage metrics is available 48-96 hours after online publication and is updated daily on week days.
Initial download of the metrics may take a while.