Fig. 3
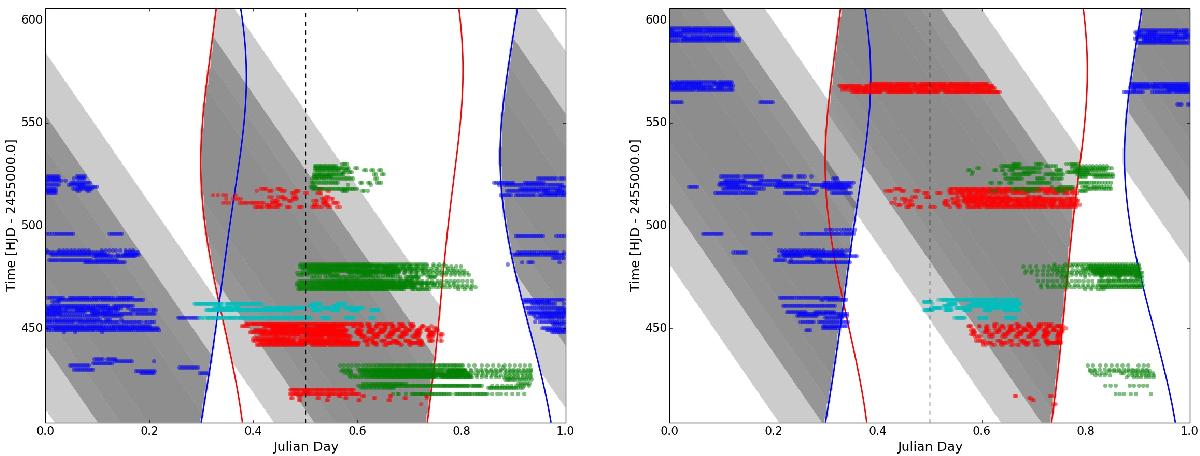
Distribution of the radial velocity measurements of γ Psc (left panel) and θ1 Tau (right panel). The same colour code as in Fig. 1. The value of the airmass X at which the target was observed is also shown for HIDES and HERMES. Light grey shaded areas indicate 2.5 <X< 3 and dark grey X< 2.5. The solid blue and red lines indicate the nautical dawn for HIDES and HERMES, respectively.
Current usage metrics show cumulative count of Article Views (full-text article views including HTML views, PDF and ePub downloads, according to the available data) and Abstracts Views on Vision4Press platform.
Data correspond to usage on the plateform after 2015. The current usage metrics is available 48-96 hours after online publication and is updated daily on week days.
Initial download of the metrics may take a while.