Fig. 15
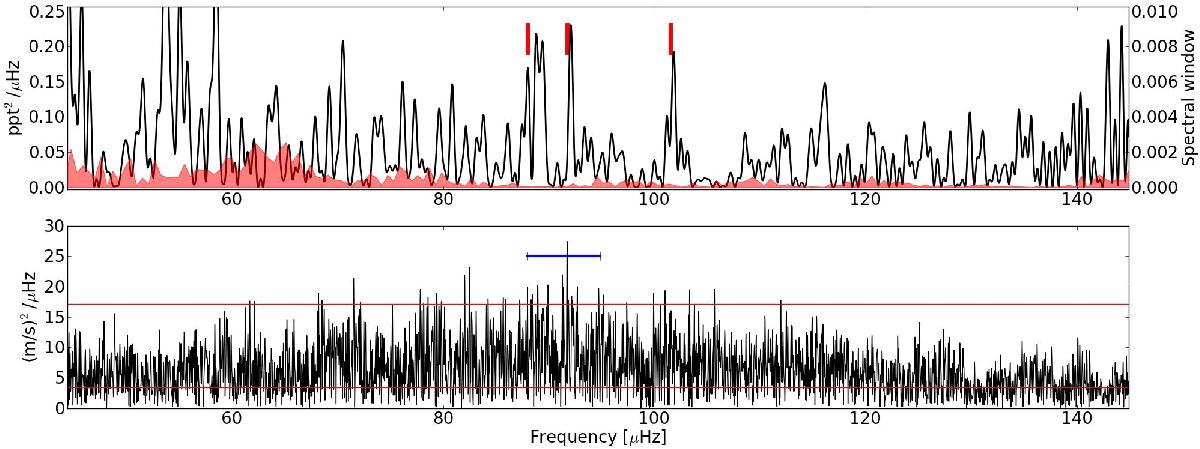
Comparison of the power spectra of the photometric and spectroscopic PDS of θ1 Tau. The top panel shows the power spectrum and the spectral window of the MOST data set as black line and red shaded region, respectively. The spectral window depicts the position of the orbital aliases and reveals that the range around νmax is nearly free of contaminations. The three main peaks in the region around 90 μHz in the MOST spectrum correspond to frequencies also detected with the ground-based campaign (red dashes). The bottom panel shows the unprewhitened power spectrum of the combined spectroscopic campaign data. The blue horizontal line indicates an average large frequency separation found for θ1 Tau. The lower and upper horizontal red line indicates the noise level and five times the noise level.
Current usage metrics show cumulative count of Article Views (full-text article views including HTML views, PDF and ePub downloads, according to the available data) and Abstracts Views on Vision4Press platform.
Data correspond to usage on the plateform after 2015. The current usage metrics is available 48-96 hours after online publication and is updated daily on week days.
Initial download of the metrics may take a while.