Fig. 14
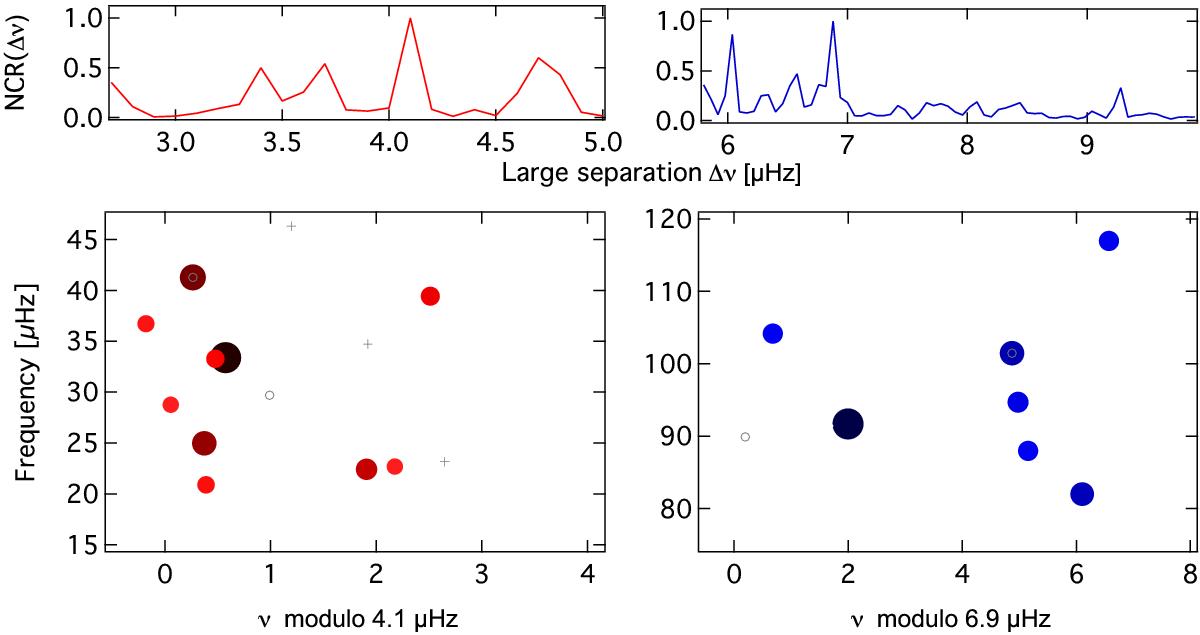
Frequency analysis of the combined data set for γ Psc (left) and θ1 Tau (right). The top panels show normalised comb response (NCR) of the six highest frequencies. The échelle diagrams (bottom panels) were calculated for the highest peak in the comb response function of γ Psc and θ1 Tau. Solid dots represent modes with an S/N ≥ 5. Open circles show the original position of modes that were shifted by 11.574 μHz. The crosses in the échelle diagram for γ Psc mark the position of multiples of the daily aliases.
Current usage metrics show cumulative count of Article Views (full-text article views including HTML views, PDF and ePub downloads, according to the available data) and Abstracts Views on Vision4Press platform.
Data correspond to usage on the plateform after 2015. The current usage metrics is available 48-96 hours after online publication and is updated daily on week days.
Initial download of the metrics may take a while.