Fig. 11
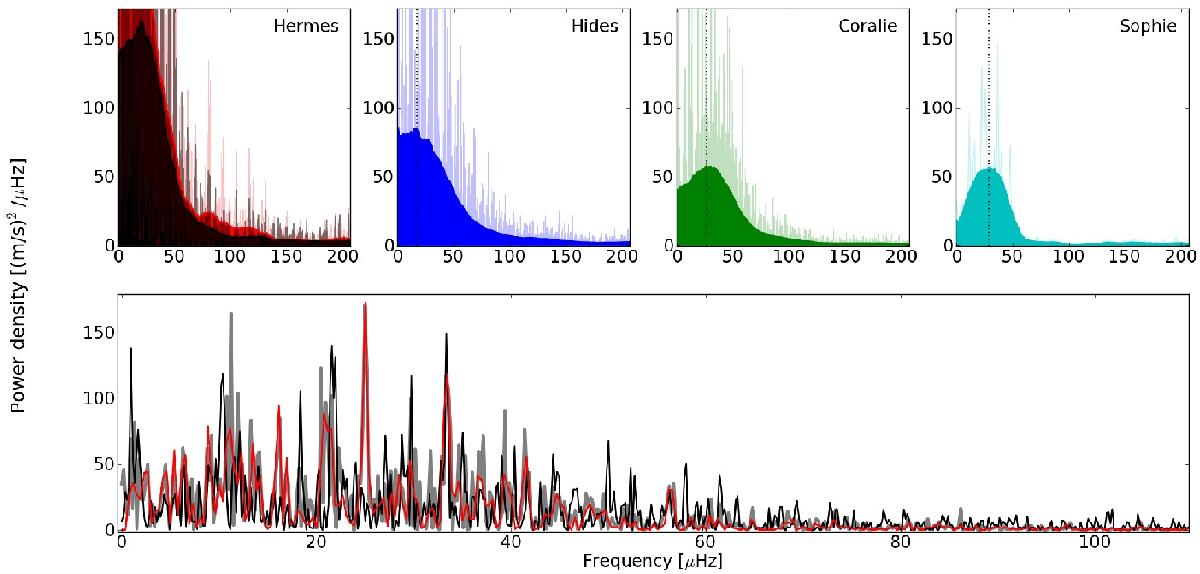
Comparison of the power spectra of γ Psc from the single instruments. The top panels show the original and the smoothed signal in the PDS for individual data sets. Two PDS are shown in the case of Hermes: the full data set was used for the red PDS and the set corrected for the radial velocity jump at 445 days (Fig. 2) was used for the black PDS. The estimate of νmax as the highest point of the smoothed PDS is marked as a dotted vertical line for each individual data set. The bottom panel shows the PDS of the combined data set, divided into two halves. The first and second half of the data set are shown as grey and black lines. The red line shows the power spectrum of the RV-subset with the best coverage (440 <t< 465 days in Fig. 2).
Current usage metrics show cumulative count of Article Views (full-text article views including HTML views, PDF and ePub downloads, according to the available data) and Abstracts Views on Vision4Press platform.
Data correspond to usage on the plateform after 2015. The current usage metrics is available 48-96 hours after online publication and is updated daily on week days.
Initial download of the metrics may take a while.