Fig. 5
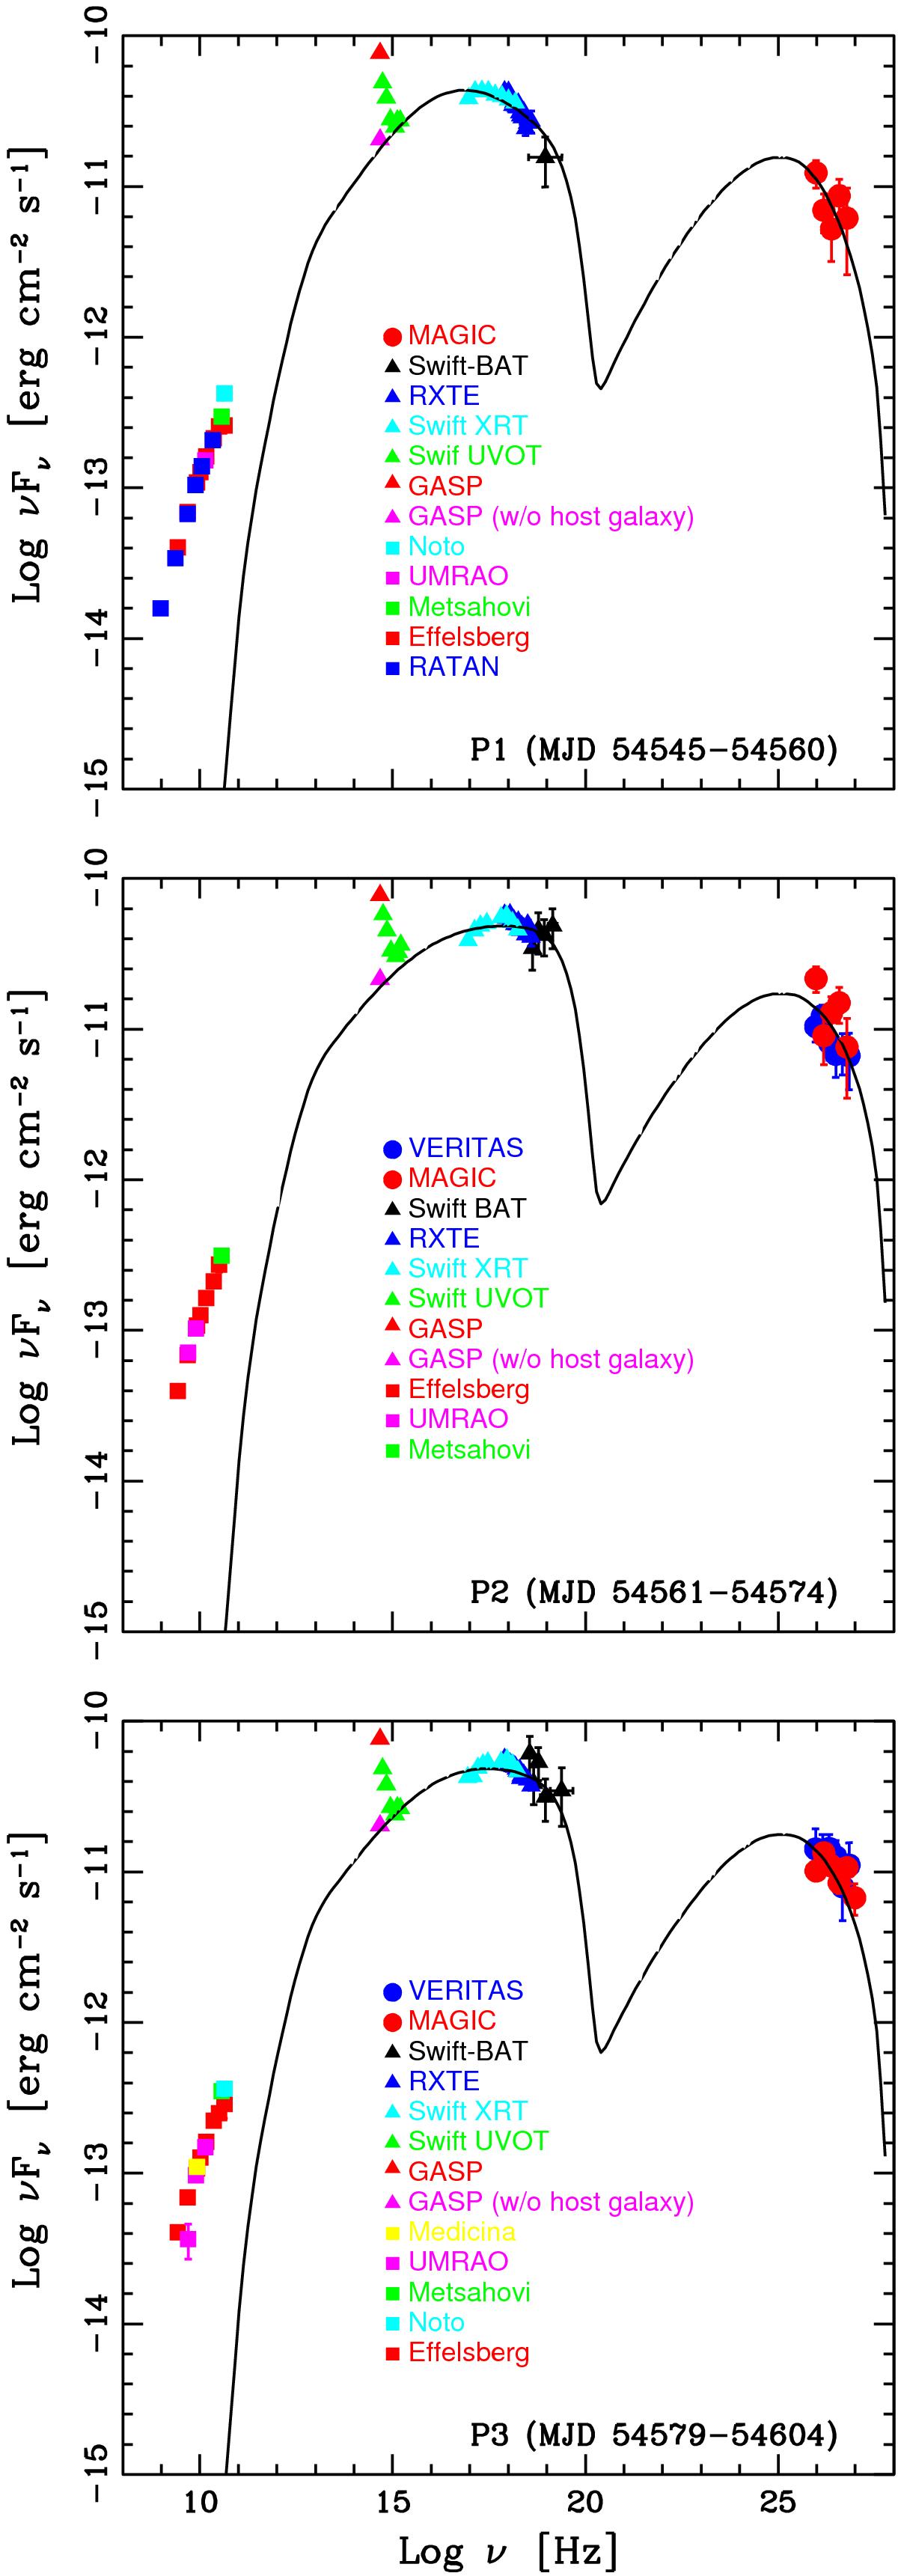
Spectral energy distributions for Mrk 501 in the three periods described in Sect. 3. The legend reports the correspondence between the instruments and the measured fluxes. Further details about the instruments are given in Sect. 2. The vertical error bars in the data points denote the 1σ statistical uncertainty. The black curve depicts the one-zone SSC model fit described in Sect. 6, with the resulting parameters reported in Table 2.
Current usage metrics show cumulative count of Article Views (full-text article views including HTML views, PDF and ePub downloads, according to the available data) and Abstracts Views on Vision4Press platform.
Data correspond to usage on the plateform after 2015. The current usage metrics is available 48-96 hours after online publication and is updated daily on week days.
Initial download of the metrics may take a while.