Fig. 3
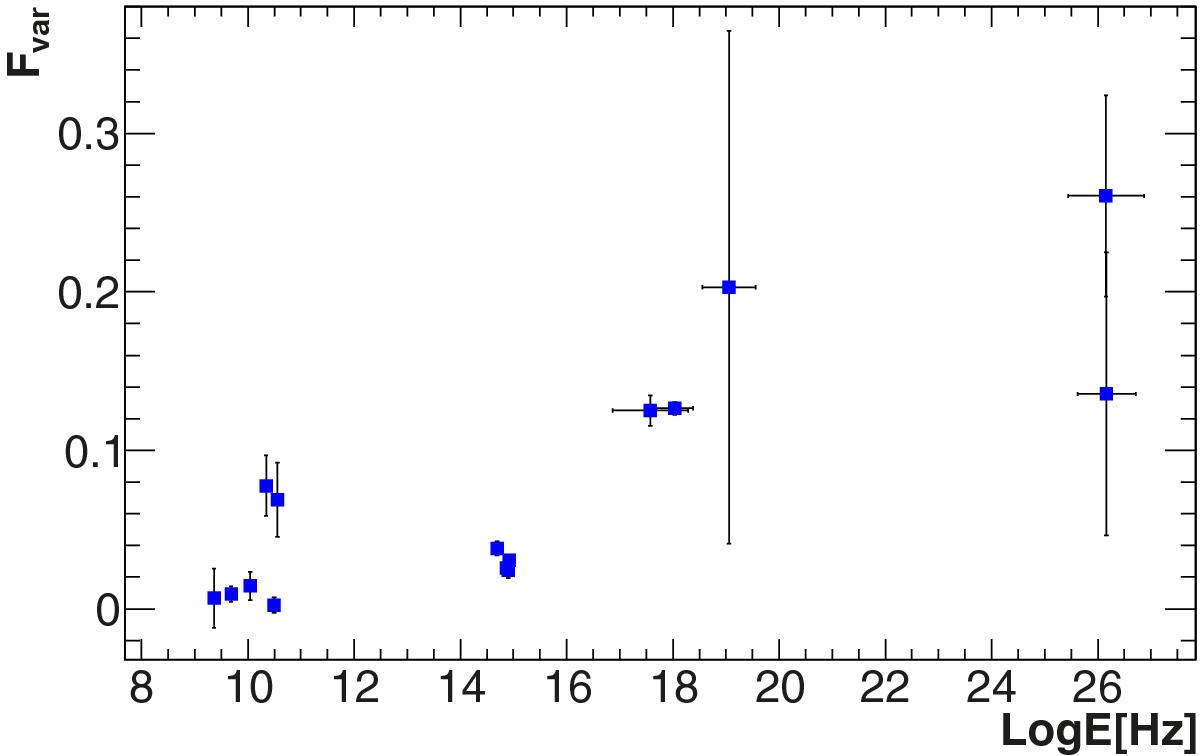
Fractional variability parameter Fvar vs. energy covered by the various instruments. Fvar was derived using the individual single-night flux measurements except for Swift/BAT, for which, because of the limited sensitivity, we used data integrated over one week. Vertical bars denote 1σ uncertainties, horizontal bars indicate the approximate energy range covered by the instruments.
Current usage metrics show cumulative count of Article Views (full-text article views including HTML views, PDF and ePub downloads, according to the available data) and Abstracts Views on Vision4Press platform.
Data correspond to usage on the plateform after 2015. The current usage metrics is available 48-96 hours after online publication and is updated daily on week days.
Initial download of the metrics may take a while.