Fig. 2
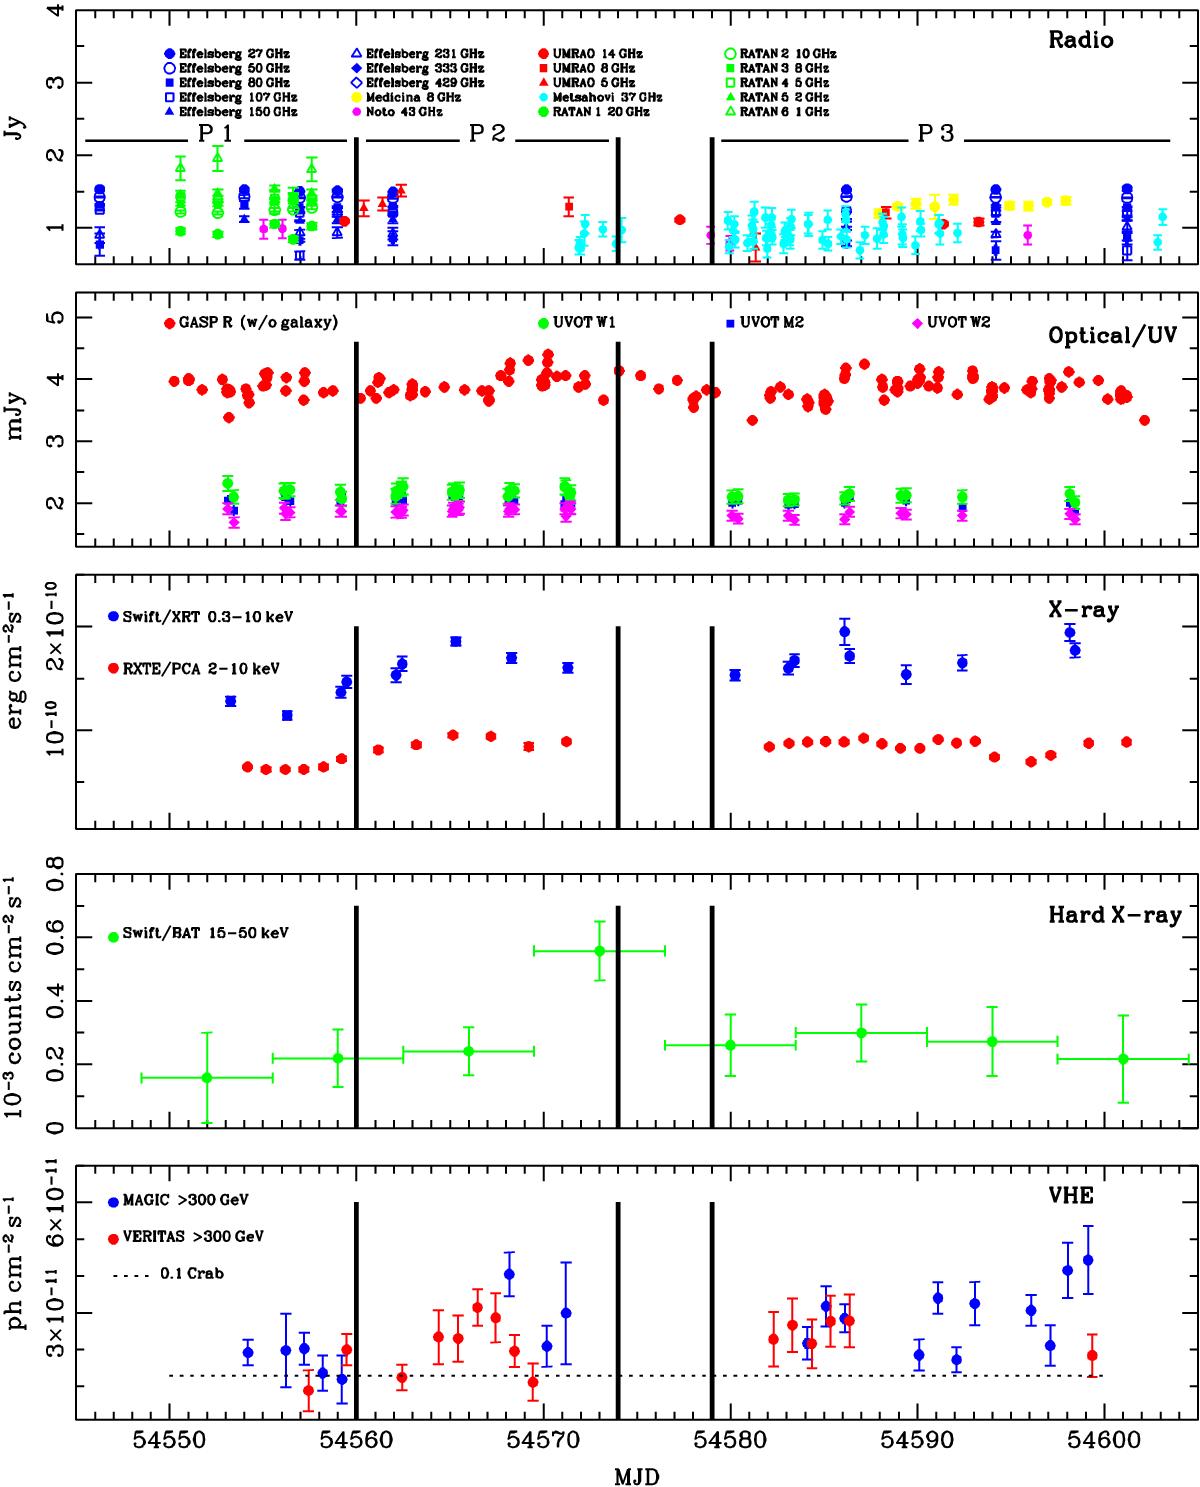
Multifrequency light curve for Mrk 501 during the entire campaign period. The panels from top to bottom show the radio, optical and UV, X-ray, hard X-ray, and VHE γ-ray bands. The thick black vertical lines in all the panels delimit the time intervals corresponding to the three different epochs (P1, P2, and P3) used for the SED model fits in Sect. 6. The horizontal dashed line in the bottom panel depicts 10% of the flux of the Crab nebula above 300 GeV (Albert et al. 2008b).
Current usage metrics show cumulative count of Article Views (full-text article views including HTML views, PDF and ePub downloads, according to the available data) and Abstracts Views on Vision4Press platform.
Data correspond to usage on the plateform after 2015. The current usage metrics is available 48-96 hours after online publication and is updated daily on week days.
Initial download of the metrics may take a while.