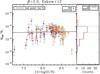
Fig. 1
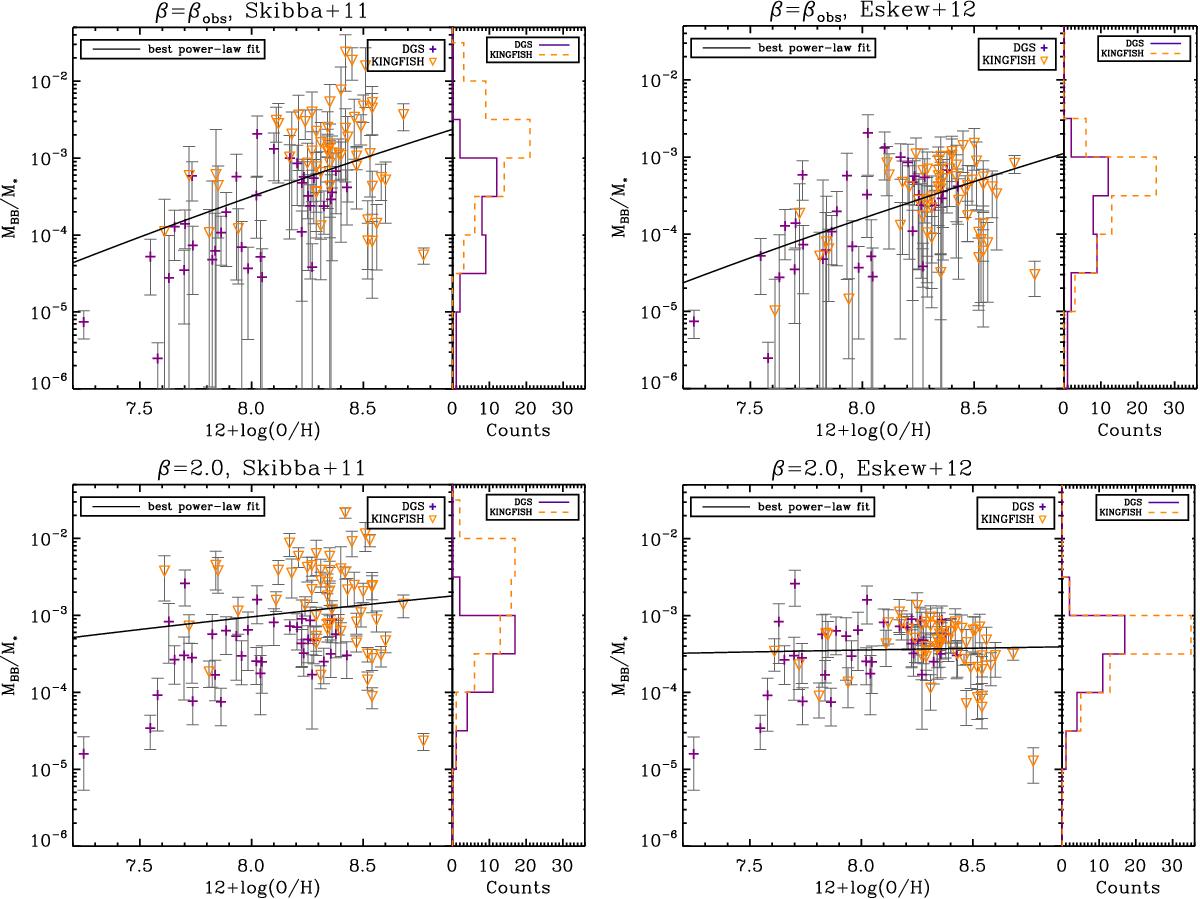
MBB/M⋆ as a function of metallicity for DGS (purple crosses) and KINGFISH (orange downward triangles). The best power-law fit is indicated as a black line. The distribution of MBB/M⋆ is indicated on the side for both samples: plain purple line for DGS and dashed orange line for KINGFISH. The errors on the metallicities are omitted for clarity. They are about 0.1 dex on average. Top left: the dust masses are from a modified blackbody fit with a free emissivity index, βobs (Rémy-Ruyer et al. 2013), and the KINGFISH stellar masses are from Skibba et al. (2011). The best fit line corresponds to log(MBB/M⋆) = (−20.5 ± 1.5) + (18.8 ± 1.6) × log(12 + log(O/H)). Top right: the dust masses are from a modified blackbody fit with a free emissivity index, βobs (Rémy-Ruyer et al. 2013), and the KINGFISH stellar masses are estimated with the formula of Eskew et al. (2012). The best fit line corresponds to log(MBB/M⋆) = (−20.2 ± 1.6) + (18.2 ± 1.7) × log(12 + log(O/H)). Bottom left: the dust masses are from a modified blackbody fit with a fixed emissivity index, β = 2.0, and the KINGFISH stellar masses are from Skibba et al. (2011). The best fit line corresponds to log(MBB/M⋆) = (−8.3 ± 1.1) + (5.9 ± 1.2) × log(12 + log(O/H)). Bottom right: the dust masses are from a modified blackbody fit with a fixed emissivity index, β = 2.0, and the KINGFISH stellar masses are estimated with the formula of Eskew et al. (2012). The best fit line corresponds to log(MBB/M⋆) = (−4.3 ± 1.2) + (0.9 ± 1.4) × log(12 + log(O/H)). This figure replaces Fig. 14 (top panel) in Rémy-Ruyer et al. (2013).
Current usage metrics show cumulative count of Article Views (full-text article views including HTML views, PDF and ePub downloads, according to the available data) and Abstracts Views on Vision4Press platform.
Data correspond to usage on the plateform after 2015. The current usage metrics is available 48-96 hours after online publication and is updated daily on week days.
Initial download of the metrics may take a while.