Fig. 4
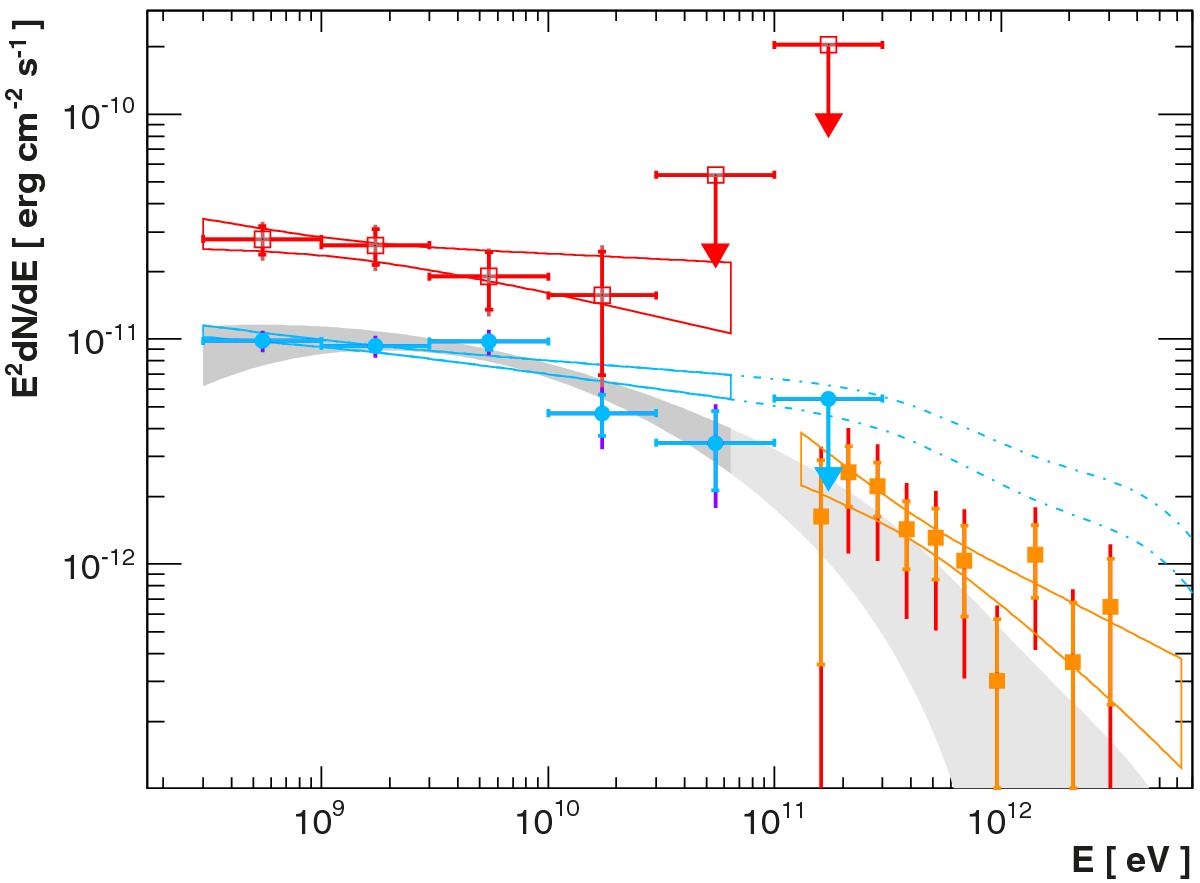
γ-ray SED of AP Librae from Fermi-LAT (blue circles) and H.E.S.S. (orange squares and butterfly power-law fit). For the quiescent state, the Fermi-LAT best-fit power-law (blue butterfly) has been extrapolated toward the H.E.S.S. energy range taking EBL absorption into account (dash-dotted line). The Fermi-LAT log-parabola fit is shown in gray, and its extrapolation taking the EBL absorption into account is shown in light gray. The flare SED as measured by Fermi-LAT is given by the red butterfly and open squares. The shorter and longer errors bars indicate statistical-only and the quadratic sum of statistical and systematic uncertainties, respectively (see text).
Current usage metrics show cumulative count of Article Views (full-text article views including HTML views, PDF and ePub downloads, according to the available data) and Abstracts Views on Vision4Press platform.
Data correspond to usage on the plateform after 2015. The current usage metrics is available 48-96 hours after online publication and is updated daily on week days.
Initial download of the metrics may take a while.