| Issue |
A&A
Volume 572, December 2014
|
|
|---|---|---|
| Article Number | A76 | |
| Number of page(s) | 10 | |
| Section | Planets and planetary systems | |
| DOI | https://doi.org/10.1051/0004-6361/201424876 | |
| Published online | 01 December 2014 | |
Dusty tails of evaporating exoplanets
I. Constraints on the dust composition
1 Anton Pannekoek Institute for Astronomy, University of Amsterdam, Science Park 904, 1098 XH Amsterdam, The Netherlands
e-mail: This email address is being protected from spambots. You need JavaScript enabled to view it.
2 Department of Astrophysics/IMAPP, Radboud University Nijmegen, PO Box 9010, 6500 GL Nijmegen, The Netherlands
Received: 28 August 2014
Accepted: 12 October 2014
Abstract
Context. Recently, two exoplanet candidates have been discovered, KIC 12557548b and KOI-2700b, whose transit profiles show evidence of a comet-like tail of dust trailing the planet, thought to be fed by the evaporation of the planet’s surface.
Aims. We aim to put constraints on the composition of the dust ejected by these objects from the shape of their transit light curves.
Methods. We derive a semi-analytical expression for the attenuation of the dust cross-section in the tail, incorporating the sublimation of dust grains as well as their drift away from the planet. This expression shows that the length of the tail is highly sensitive to the sublimation properties of the dust material. We compute tail lengths for several possible dust compositions, and compare these to observational estimates of the tail lengths of KIC 12557548b and KOI-2700b, inferred from their light curves.
Results. The observed tail lengths are consistent with dust grains composed of corundum (Al2O3) or iron-rich silicate minerals (e.g., fayalite, Fe2SiO4). Pure iron and carbonaceous compositions are not favoured. In addition, we estimate dust mass loss rates of 1.7 ± 0.5 M⊕ Gyr-1 for KIC 12557548b, and > 0.007 M⊕ Gyr-1 (1σ lower limit) for KOI-2700b.
Key words: eclipses / occultations / planets and satellites: composition / planets and satellites: individual: KIC 12557548b / planets and satellites: individual: KOI-2700b / planet-star interactions
© ESO, 2014
1. Introduction
The recently discovered exoplanet candidates KIC 12557548b (hereafter KIC 1255b) and KOI-2700b show asymmetric transit profiles, that can be explained by the occultation of stars by comet-like tails of dust emanating from evaporating exoplanets (Rappaport et al. 2012, 2014). The plausibility of this scenario has been strengthened by quantitative modelling of the transit light curve (Brogi et al. 2012; Budaj 2013; van Werkhoven et al. 2014), and of the Parker-type thermal wind that can eject dust grains from the planetary atmosphere (Perez-Becker & Chiang 2013). Table 1 lists the basic properties of the two systems.
If the evaporating-planet scenario is correct, KIC 1255b and KOI-2700b may provide a rare chance to probe the interiors of small exoplanets. Since the dust tails are thought to originate in the atmospheres of the planets, which are fed by the evaporating planetary surfaces, knowledge of the dust composition would provide information about the composition of the planets. This, in turn, would shed light on the origin and evolutionary history of the planets, and would therefore comprise a valuable constraint for theories of planet formation and evolution.
In this paper, we demonstrate that measurements of the length of a dust tail can be used to put constraints on the composition of the dust grains in the tail (see also Kimura et al. 2002). In Sect. 2, we show how the tail length is related to the rate at which dust grains become smaller as a result of sublimation and the rate at which they drift away from the planet. In Sect. 3, we apply this theory to the two candidate evaporating planets discovered thus far, testing how well several possible dust species explain the observations. Finally, in Sect. 4 we discuss our findings, and in Sect. 5 we list our conclusions.
 |
Fig. 1 Diagrams of the path followed by a dust grain released from an evaporating planet (ignoring sublimation of the dust grain) for 3 orbital periods of the planet, in the inertial frame and in the frame corotating with the planet. The positions of the planet and the dust particle are indicated at a time 1.6 orbital periods of the planet after release. |
2. Cross-section decay in a dusty tail
In this section, we derive an expression for the decay of extinction cross-section per unit angle W with angular separation from the planet Δθ. This equation will describe how the depth of the transit depends on the mass loss rate of the planet, and how the length of the tail depends on the material properties of the dust. In our derivation we make use of the following assumptions, whose validity is discussed in the derivation and in Sect. 4.1:
-
1.
The dust tail can be treated as if it were in steady state.
-
2.
The tail is radially optically thin throughout.
-
3.
The cross-section in the tail is dominated by dust grains with the same initial size.
-
4.
The grains can be treated as simple spheres.
-
5.
The optical efficiencies of the grains (i.e., Qabs, Qscat, etc.) do not change significantly as the grains become smaller.
-
6.
The dust grains survive for at least one orbit.
-
7.
The orbit-averaged sublimation rate of a dust grain does not change substantially as a grain becomes smaller.
-
8.
Sublimation of dust grains can be treated as in vacuum. Gas released by the planet does not offset the sublimation through recondensation.
-
9.
The planet’s orbit is circular.
-
10.
The size of the planet is negligible compared to the length of the dust tail (i.e., grains are released from a single point).
-
11.
Dust temperatures are determined by absorption and reradiation of stellar radiation.
-
The dynamics of the dust grains are dominated by drift due to radiation pressure. The initial relative velocities with which the particles are released from the planet are negligible.
Table 1Host star and system parameters of the two evaporating exoplanet candidates.
 (1)where dn/ dΔθ is the number of particles per unit angle, σext is the extinction cross-section of a single dust grain, and R⋆ is the stellar radius. The angular number density can be expanded into
  (2)Here, t denotes time, dn/ dt is the rate at which the planet releases particles, the brackets ⟨ ... ⟩ indicate averaging over the orbit of the dust grain, Ṁd is the dust mass loss rate of the planet (i.e., excluding the mass lost in gas), and m0 is the mass of an individual dust grain when it leaves the planet. The extinction cross-section of a single dust grain as a function of angular separation σext(Δθ) can be inferred from its derivative, which can be expanded into
  (3)Here, s is the grain radius.
In the following subsections, we derive expressions for the size dependence of extinction cross-section dσext/ ds (Sect. 2.1), the azimuthal drift rate ⟨dΔθ/ dt⟩ (Sect. 2.2), and the grain radius change rate ⟨ds/ dt⟩ (Sect. 2.3). These are then combined using Eqs. (1)–(3)to yield the equation for the decay of extinction cross-section (Sect. 2.4).
2.1. Extinction cross-section
The extinction cross-section of a spherical dust grain with radius s can be expressed as  (4)Here,
  is the extinction efficiency averaged over the stellar spectrum and the spectral response function of the instrument. We calculate monochromatic extinction efficiencies from (material dependent) refractive index data using Mie (1908) theory. The sources of refractive index data are listed in Table 2. For the stellar spectra we take Kurucz (1993) models1. The Kepler response function is described by Koch et al. (2010). Figure 2 shows the resulting extinction efficiencies.
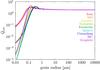 |
Fig. 2 Wavelength-averaged extinction efficiency |
Bulk densities and sources for optical properties of the dust species considered in this study.
Figure 2 shows that the extinction efficiency does not change substantially with grain size ( ) for s ≳ 0.1–0.5 μm, depending on material type. In this regime, we can make the approximation
  (5)
(5)
2.2. Drift due to radiation pressure
The dynamics of small dust grains is significantly affected by radiation pressure from the star. Since the radiation pressure force scales the same way with distance from the star as gravity, it is parametrised by β, the ratio between the norms of the direct radiation pressure force and the gravitational force (i.e., β = | Frad/Fgrav |). For spherical dust grains, this parameter is given by (e.g., Burns et al. 1979) 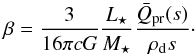 (6)Here, c is the speed of light, G is the gravitational constant, L⋆ is the stellar luminosity, M⋆ is the stellar mass,
  is the radiation pressure efficiency averaged over the stellar spectrum, and ρd is the bulk density of the dust. Figure 3 shows the β ratios for dust grains of different compositions, using the stellar parameters listed in Table 1, bulk densities from Table 2, and values derived from the Mie calculations described in Sect. 2.1.
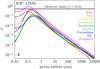 |
Fig. 3 Radiation pressure to gravitational force ratio β as a function of grain radius s for KIC 1255b. Different colours correspond to the materials listed in Table 2. Uncertainties (due to uncertainties in stellar parameters) are indicated by the error bar in the bottom left. The same figure for KOI-2700b is qualitatively the same, but the β values are lower by a factor of about 1.5. |
After being released from a planet that follows a circular Keplerian orbit, radiation pressure-affected particles will continue on new Keplerian orbits with eccentricities ed, semi-major axes ad, and periods Pd given by (e.g., Rappaport et al. 2014) 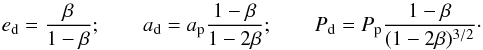 (7)Here, ap, and Pp denote the semi-major axis and orbital period of the planet, respectively. We note that particles with β ≥ 0.5 leave the system on unbound orbits.
Because of its eccentric orbit, a dust grain will drift away azimuthally from the planet and oscillate in radial distance, giving rise to a rosette-like path in the corotating frame (see Fig. 1). Averaged over the particle’s orbit (but ignoring sublimation), the azimuthal drift rate equals the synodic orbital frequency, which is given by (Rappaport et al. 2014) 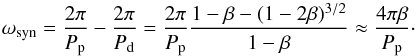 (8)The mathematical approximation in the last step gives an error of less than about 5% for all β< 0.5, and less than 0.5% for all β< 0.1. Compared to the actual (non-orbit-averaged) drift, this constant drift rate gives errors in Δθ of less than 15% after the first orbit for β< 0.1 (see also Fig. 7).
The azimuthal drift of a grain is described by Δθ(t) = ωsynt. Since ωsyn depends on β, a particle’s drift rate will change as it becomes smaller because of sublimation. Using the assumption that the radiation pressure efficiency does not change substantially with decreasing grain size ( , which roughly holds for s ≳ 0.1–0.5 μm, depending on material type), we find
  where s0 denotes the initial grain radius. The final step uses the assumption that the orbit-averaged sublimation rate remains constant, which implies that the evolution of a grain’s radius is described by s(t) = s0 + ⟨ds/ dt⟩t.
Sublimation characteristics of the dust species considered in this study.
2.3. Dust sublimation
While a dust particle drifts away from the planet, it will gradually sublimate because of the equilibrium temperature it reaches when illuminated by the stellar radiation. Since we consider spherical dust grain, whose mass and surface area are given by m = 4/3πs3ρd and A = 4πs2, respectively, the orbit-averaged rate at which the grain radius changes can be rewritten as 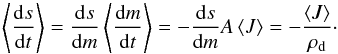 (11)Here, J denotes the mass loss flux from the surface of the dust grain (units: [g cm-2 s-1]; positive for mass loss).
According to the kinetic theory of gases, a solid surface with temperature T in vacuum loses mass at a rate of (Langmuir 1913) 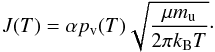 (12)Here, α is the evaporation coefficient that parameterises kinetic inhibition of the sublimation process (which we assume to be independent of temperature), pv is the material-specific phase-equilibrium vapour pressure, μ is the molecular weight of the molecules that sublimate2, mu is the atomic mass unit, and kB is the Boltzmann constant. The temperature dependence of the equilibrium vapour pressure can be approximated by
  (13)where
  and ℬ are material-dependent sublimation parameters that can be determined experimentally. Table 3 lists estimates of the sublimation parameters for the materials we consider.
A particle on an eccentric orbit has different temperatures Td at different parts of its orbit. When computing the orbit-averaged mass loss flux, J(Td) has to be weighed by the time spent in each part of the orbit. This gives ![Mathematical equation: \begin{equation} \label{eq:subl_mean} \left< J \right> = \frac{ 1 }{ 2 \pi } \int \limits_{ 0 }^{ 2 \pi } J [T\sub{d} ( \theta\sub{d} )] \frac{ ( 1 - e\sub{d}^2 )^{3/2} }{ (1 + e\sub{d} \cos \theta\sub{d} )^2 } \, \dif \theta\sub{d}, \end{equation}](/articles/aa/full_html/2014/12/aa24876-14/aa24876-14-eq104.png) (14)where θd is the true anomaly of the dust grain, and Td depends on θd through distance
(14)where θd is the true anomaly of the dust grain, and Td depends on θd through distance 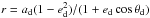 .
.
 |
Fig. 4 Dust temperatures Td at the orbital distance of the planet as a function of grain radius s for various dust materials. The horizontal black lines mark the black-body temperatures at the distances of the planets. The grey bands indicate the uncertainties on the black-body temperatures, and can be used as estimates of the typical uncertainties on the grain temperatures. |
The temperature Td(s,r) of a dust grain with size s at distance r from the (centre of the) star can be found by solving the energy balance 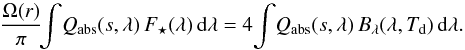 (15)Here, λ denotes wavelength, Qabs is the monochromatic absorption efficiency of the dust grain, F⋆ is the stellar spectrum, Bλ denotes the Planck function, and Ω(r) is the solid angle subtended by the star as seen from a distance r, which is given by
 ![Mathematical equation: \hbox{$ \Omega( r ) = 2 \pi [1 - \sqrt{ 1 - ( R\sub{\star}/r )^2 }] $}](/articles/aa/full_html/2014/12/aa24876-14/aa24876-14-eq114.png) . Figure 4 shows the grain temperatures of dust particles made of several different materials at the orbital distance of KIC 1255b and KOI-2700b. We use Qabs values derived from the Mie calculations described in Sect. 2.1. For F⋆(λ), we use Kurucz (1993) models (see footnote 1) scaled with the stellar luminosity. At large grain sizes, temperatures of most of the investigated materials approach the black-body temperature
. Figure 4 shows the grain temperatures of dust particles made of several different materials at the orbital distance of KIC 1255b and KOI-2700b. We use Qabs values derived from the Mie calculations described in Sect. 2.1. For F⋆(λ), we use Kurucz (1993) models (see footnote 1) scaled with the stellar luminosity. At large grain sizes, temperatures of most of the investigated materials approach the black-body temperature ![Mathematical equation: \begin{equation} \label{eq:temp_bb} T\sub{bb}(r) = \left[\frac{ \Omega( r ) }{ 4 \pi } \right]^{1/4} T\sub{ eff, \star }. \end{equation}](/articles/aa/full_html/2014/12/aa24876-14/aa24876-14-eq116.png) (16)At the distance of the planet, this gives
(16)At the distance of the planet, this gives  K for KIC 1255b and
  K for KOI-2700b (indicated by the horizontal bands in Fig. 4).
2.4. The decay equation
We can now combine the above equations into an expression for the decay of extinction cross-section. By combining Eqs. (3)−(6), (10), and (11), we find 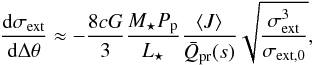 (17)where σext,0 is a particle’s extinction cross-section when it is released from the planet. Integration then yields
 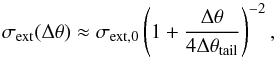 (18)where Δθtail is the characteristic angle of the tail’s decay (defined below). Inserting this into Eq. (1), together with Eqs. (2), (6)and (10), gives the final expression for the decay of extinction cross-section per unit angle with angular separation from the planet
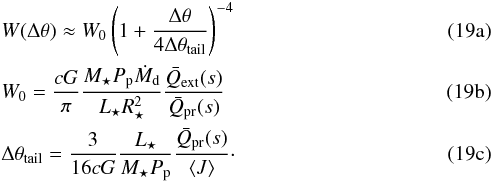
3. Constraints from observed light curves
With the theoretical background in place, we now investigate what constraints can be derived from the observed light curves of KIC 1255b and KOI-2700b. To do this properly, one would have to use a transit model that computes the light curve resulting from the occultation of a star by a dust tail whose extinction cross-section distribution is given by Eq. (19a). Such models exist (Brogi et al. 2012; Budaj 2013; van Werkhoven et al. 2014; Rappaport et al. 2014), but they generally adopt an ad hoc exponential decay for W(Δθ). While the decay predicted by Eq. (19a)is shallower than exponential, the profiles are similar enough to use the normalisation constants and e-folding angles derived from light curve fits as estimates for W0 and Δθtail, respectively3.
The literature values we adopt for the cross-section distribution parameters are listed in Table 4. KOI-2700b only has a lower limit on W0. This is because its ingress is not resolved well, which allows tails with higher cross-section densities at higher transit impact parameters. We determined the lower limit on W0 from the transit depth of δ = 360 ± 29 ppm (Rappaport et al. 2014). In the limit that the tail is short compared to the chord on the stellar disk crossed by the planet4, the transit depth corresponds to the total amount of extinction cross-section in the tail, which can be found by integrating Eq. (18). Hence, we find  (20)This ignores the limb darkening of the star as well as the forward scattering of starlight into the line of sight. It also assumes that the planet does not contribute significantly to the flux deficit.
Constraints on the dust tail cross-section distribution parameters derived from transit light curve fitting.
3.1. Mass loss rates of the planets
The observational constraints on the normalisation constant W0 can be used to estimate the dust mass loss rate of the evaporating planet (i.e., excluding mass lost in gas). Rewriting Eq. (19b)gives  (21)For large grains, we can approximate
  and
and  . For KIC 1255b, this yields Ṁd ≈ 1.7 ± 0.5 M⊕ Gyr-1, which is somewhat higher than earlier (grain-property-dependent) estimates by Rappaport et al. (2012), Perez-Becker & Chiang (2013), and Kawahara et al. (2013). For KOI-2700b, we find a 1σ lower limit of Ṁd ≳ 0.007 M⊕ Gyr-1, consistent with the estimate of Rappaport et al. (2014).
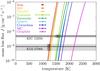 |
Fig. 5 Mass loss flux as a function of temperature (Eq. (12)) for different materials, whose properties are listed in Table 3. Typical uncertainties (in temperature) are indicated by the error bars next to the legend. The horizontal lines mark the sublimation rates required to explain the observed tail lengths (Eq. (22)), with light grey bands indicating their uncertainties. The black-body temperatures (Eq. (16)) at the distance of the planets and their uncertainties are indicated by vertical line segments and dark grey patches. |
3.2. Dust composition
The observed tail length can be used together with system parameters and (valid for large grains) in Eq. (19c)to estimate the required orbit-averaged mass loss flux of the grains  (22)This gives ⟨J⟩ ≈ (4.7 ± 1.1) × 10-9 g cm-2 s-1 for KIC 1255b and
  for KOI-2700b.
In Fig. 5, we compare these observational constraints on the sublimation rate with laboratory J(T) curves for different materials. Typical uncertainties on the temperature were estimated at J = 10-8 g cm-2 s-1 using a Monte Carlo technique (i.e., by varying and ℬ according to their respective uncertainties, and then numerically solving Eq. (12)for T). We also mark the black-body temperature (Eq. (16)) at the distance of the planet for both systems. The difference in temperature between the two systems (greater than what can be explained by the trend of any of the material curves) indicates that the dust in the two systems may have a different composition, with KIC 1255b requiring a more refractory species than KOI-2700b. Furthermore, some materials reach the required sublimation rates at temperatures much lower or higher than the typical (black-body) temperatures of the systems, suggesting that the dust is unlikely to be composed of these materials. However, dust temperatures can depart considerably from black-body temperatures (see Fig. 4). In addition, particles on eccentric orbits experience lower temperatures when they are farther away from the star.
To investigate the effects of size-dependent grain temperatures, we use Eq. (19c)to calculate tail lengths as a function of grain size, employing orbit-averaged sublimation rates from Eq. (14), realistic dust temperatures from Eq. (15), and size-dependent values derived from the Mie calculations described in Sect. 2.1. The results are shown in Fig. 6, together with the observed tail lengths for comparison. Typical uncertainties were estimated at s = 1000μm using Monte Carlo simulations. For some materials, particles of certain sizes sublimate entirely before completing one orbit (s0/ ⟨ds/ dt⟩ <Pd), meaning that assumption 6 of our derivation is violated. In these cases, the tail length as predicted by Eq. (19c)is shown in Fig. 6 with dashed lines (while strictly Eq. (19c)is no longer valid; also see Sect. 4.1). At small grain sizes (s ≲ 0.1μm), assumption 5 breaks down, because then varies strongly with grain size. At the largest grain sizes considered here (s ≳ 1000μm), grain temperatures approach the black-body temperature, and hence the results in Fig. 6 converge to those of Fig. 5 (but we note that such large dust grains are not very plausible; see Sect. 4.2).
Figure 6 displays an extremely large dynamic range in predicted tail lengths, caused by the exponential dependence of sublimation rate on grain temperature (see Eqs. (12)and (13)). For most of this range, dust tails are probably not detectable by transit photometry. Small tail lengths (Δθtail ≲ 0.01) effectively leave only the parent planet, which makes a regular, symmetric light curve. Large values (Δθtail ≳ 100) occur if dust grains hardly sublimate at all, giving rise to a nearly uniform ring of dust around the star. Such a ring would scatter and absorp the same amount of light at all phases, and would therefore not produce a signal in the normalised light curve.
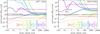 |
Fig. 6 Characteristic angle of the tail’s decay as a function of grain size (Eq. (19c)) for KIC 1255b and KOI-2700b, with different colours for different materials. Dashed lines indicate that particles sublimate entirely before completing one orbit. Gaps (neither a solid nor a dashed line) appear where particles are unbound (β ≥ 0.5). Typical uncertainties are shown by the error bars at the bottom of each panel. The horizontal black lines indicate the values of Δθtail derived from the observed light curves. |
The tail length predictions of Fig. 6 allow us to put constraints on the composition of the dust in the tails of the two evaporating exoplanet candidates. For KIC 1255b, we find the following: (1) iron, fayalite, and silicon monoxide give tail lengths that are smaller than the observed value, because of their low sublimation temperatures. (2) The silicate minerals quartz, forsterite, and enstatite can produce the observed tail length, but only at very large grain sizes (s ≳ 100μm). Smaller grains have lower temperatures (owing to their transparency in the optical), and therefore sublimate much slower. (3) Corundum grains with sizes of around s ~ 10μm are consistent with the observations. (4) The carbonaceous materials graphite and silicon carbide generally give tail lengths that are much longer than the observed value, because of their refractory nature. An exception are very small (s ~ 0.01μm) graphite grains, which marginally fit the observed tail length.
The constraints for KOI-2700b, which is cooler, are somewhat different: (1) Iron, which seems to be a good candidate in Fig. 5, yields tails that are shorter than observed, because of its higher-than-black-body temperature. (2) Fayalite grains of many different sizes are consistent with the observed tail length. (3) Silicon monoxide gives the observed tail length for very large grain sizes (s ~ 1000μm). (4) The silicate minerals quartz, forsterite, and enstatite, as well as the carbonaceous materials graphite and silicon carbide all yield tails that are much longer than indicated by the observations. (5) Corundum grains with sizes of s ≲ 1μm give the observed tail length.
The above results are discussed in more detail in Sect. 4.3, where they are examined in the light of independent constraints on the typical size of the dust grains.
4. Discussion
4.1. Validity of assumptions
Our semi-analytical model makes use of a number of assumptions, listed at the beginning of Sect. 2. In the above derivation and analysis, we already give arguments for some of these assumptions, or discuss under what conditions they are valid. Many of the assumptions, however, warrant some further discussion, which we provide here.
-
Steady state (assumption 1): it is clear that the dusttail of KIC 1255b is not in steady state, because itexperiences drastic changes in transit depth from orbit to orbit(Rappaport et al. 2012). Thisvariability is, in fact, an important argument for the evaporating-planet scenario. For KOI-2700b, the Kepler data do not have thesignal-to-noise ratio required to detect orbit-to-orbit changes intransit depth, but a secular trend in transit depth was found (Rap-paport et al. 2014). The resultswe find under the assumption of a steady-state dust tail, using theaverage observed light curve, reflect the properties of the systemaveraged over time.
-
Optical depth (assumption 2): Rappaport et al. (2012) argue that the star-to-planet part of the dust cloud must be optically thin or marginally so (i.e., τ ≲ 1) in order for the planet to be heated sufficiently by stellar radiation to sublimate. Indeed, Perez-Becker & Chiang (2013) find that the mass loss rate of the planet goes down for high dust abundances, and reaches a maximum at optical depths of about τ ≈ 0.1 (see their Fig. 4). Furthermore, shielding of dust grains by each other from the stellar radiation is reduced by the large angular diameter of the star from the vantage point of the dust cloud (27° for KIC 1255b; 19° for KOI-2700b). Regarding the optical depth from the star to the observer, it is important to take into account that the dust cloud is inclined with respect to the line of sight (for non-zero impact parameters). This lowers the optical depth because it ensures that the radial extent of the dust cloud (which can be substantial because of the different paths followed by grains of different sizes) contributes to its vertical extent with respect to the line of sight.
-
Single grain size (assumption 3): without knowledge of the actual grain size distribution, our analysis assuming a single grain size can still be used to exclude many dust compositions. If a given dust species yields tail lengths that, for all plausible grain sizes, are either always longer or always shorter than the observed value (i.e., its curve in Fig. 6 lies either fully above or fully below the horizontal black line), it is not possible to create the observed tail length with a combination of different-sized grains of this composition.
-
Constant optical efficiencies (assumption 5): Fig. 2 shows for which grain sizes the extinction efficiency remains constant. The independence of transit depth on wavelength (Croll et al. 2014) indicates that this assumption is at least correct for the extinction efficiency in the case of KIC 1255b, although the possible effects of the optical depth of the dust cloud should be investigated. For the emission efficiency (relevant to the energy balance of the dust grains) the assumption only becomes accurate at much larger grain sizes (see discussion of assumption 7 below).
-
Survival timescale (assumption 6): we assume that particles survive against sublimation for at least one orbit. Arguments based on the variability timescale presented by Rappaport et al. (2012) and Perez-Becker & Chiang (2013) indicate that this is marginally the case for KIC 1255b. For KOI-2700b, dust grains with β ≲ 0.03 need to survive for longer than one dust orbit to explain the length of the tail (ignoring sublimation; see also Sect. 4.5 of Rappaport et al. 2014). This assumption is needed to justify averaging over the orbit of the dust particle. For low-eccentricity orbits, however, this does not introduce a large error.
-
Constant sublimation rate (assumption 7): our assumption that the orbit-averaged sublimation rate does not change as particles become smaller means that we make a zeroth-order approximation in dust temperature. This is only valid at very large grain sizes, for which black-body temperatures are a good approximation. Avoiding this simplification would require a numerical approach to modelling the dust tail. Assumption 7 also means that we do not take into account the changes in orbital eccentricity that are caused by the changes in β of a shrinking dust grain. This second point is a good approximation as long as orbital eccentricities are low, such that the sublimation rate does not vary substantially from its periastron value.
-
Dust temperatures (assumption 11): when computing dust temperatures from the energy balance Eq. (15), we assume that the contribution of latent heat due to sublimation is negligible. This is valid for the materials and temperatures we consider (Lamy 1974; Rappaport et al. 2014). Collisional heating by stellar wind particles can also be ignored (Rappaport et al. 2014).
-
Radiation pressure dominated dynamics (assumption 12): for the dynamics of the dust grains, we only take into consideration the gravity and radiation pressure of the star. Rappaport et al. (2014) find that the ram pressure force due to the stellar wind is one or two orders of magnitude lower than the radiation pressure force, and can therefore be ignored. Assumption 12 also requires that the initial relative velocity Δv0 with which the grain is launched away from the planet is negligible compared to the radiation-pressure-induced drift. This holds if Δv0 ≪ 2βvp, where
 is the planet’s Keplerian velocity. Using Kepler’s third law, this can be rewritten as
  (23)The magnitude of the initial relative velocity Δv0 is very uncertain. It may be comparable to the escape speed of the planet, but this depends on the precise coupling of the dust grains to the gas flow. We do not expect Δv0 to be more than a few km s-1, and therefore assumption 12 should be valid for grains with radii up to about s ≲ 10μm. Importantly, if this condition were violated, and dust grains are launched isotropically, some particles would end up drifting ahead of the planet. The transit light curve resulting from such a configuration would display a gradual ingress. In the observed light curve, only the egress is gradual, consistent with grain dynamics that are dominated by radiation pressure.
4.2. Constraints on the grain size
Section 3.2 revealed that our constraints on the dust composition are dependent on the size of the dust grains, primarily because the grain size influences the grain temperature. By using independent constraints on the grain size, it is therefore possible to make better inferences about the dust composition. Here, we list the available constraints on the grain size (most of which only concern KIC 1255b):
-
1.
Brogi et al. (2012) find that thescattering properties of the dust trailingKIC 1255b, as imprinted on the light curve, arebest explained by small particles (0.04 μm <s< 0.19μm).
-
2.
In a similar analysis, Budaj (2013) finds that the pre-ingress brightening of KIC 1255b is best explain by grains of s ~ 0.1–1 μm, while smaller grains (s ~ 0.01–0.1 μm) are better at explaining its egress.
-
3.
From the independence of the transit depth of KIC 1255b on wavelength, Croll et al. (2014) derive a 3σ lower limit on the grain size of s ≳ 0.5μm (s ≳ 0.2μm for iron grains).
Fig. 7 Angular separation between dust grains and the planet KIC 1255b as a function of time for different values of β (the ratio of radiation pressure to gravitational force on a dust grain). The horizontal grey line indicates the position of the tentative flux decrement in the egress with respect to the midpoint of the transit.
Table 5Summary of the dust composition constraints.
-
4.
In the phase-folded short cadence light curve of KIC 1255b, Croll et al. (2014) tentatively detect a small decrement of flux in the egress, about 0.15 phase units after the midpoint of the transit (corresponding to an angular separation from the planet of Δθdecr ≈ 0.15 × 2π ≈ 0.94 rad). If this feature is real, it may be related to the first periastron passage of the dust grains after launch. The periastron passage gives an enhancement in the dust density because the relative angular velocity between dust and planet vanishes when dust particles pass their periastron. This is illustrated by Fig. 7, which shows the drift of dust particles with respect to the planet (ignoring sublimation), calculated by solving Kepler’s equation (see also Fig. 1, as well as Sect. 4.1 and Fig. 11 of Rappaport et al. 2014). The figure demonstrates that the angular offset of the dust density enhancement is very sensitive to β, and hence to the size of the dust grains. This also implies that, if the flux decrement feature is real and it is caused by the periastron passage of dust grains, the grain size distribution must be very narrow. Ignoring sublimation, the relation between the β ratio of the dust grains and the position of the density enhancement is
 (24)The observed angular offset of the possible flux decrement of Δθdecr ≈ 0.94 rad corresponds to β ≈ 0.064. This β ratio is reached by particles of various sizes, depending on material type (see Fig. 3), but leads to a tentative upper limit of roughly s ≲ 2μm, since larger grains always have lower β ratios.
 -
5.
For very small values of β, the motion of dust grains is probably dominated by the initial velocity with which they are launched away from the planet, rather than radiation-pressure-induced drift (see Eq. (23)). Large grains may therefore result in a more symmetric distribution of dust around the planet, contrary to what is observed. For this reason, we deem dust grains with sizes of s ≳ 100μm unlikely.
-
6.
Perez-Becker & Chiang (2013) assume s = 1μm for their atmospheric outflow model, and find that grains up to this size couple sufficiently to the gas to be lifted out of the planetary atmosphere by a thermal wind. Although the resulting upper limit on grain size is model-dependent (it varies with planet mass, for example), this is an additional argument against very large grain sizes.
Combined, the above pieces of evidence point to grain sizes of about s ~ 0.1–1 μm for KIC 1255b, although some of the clues are contradictory. For both objects, there are arguments to exclude very large dust grains (s ≳ 100μm). Future research should examine whether a uniform grain size is a good approximation. It is also important to determine the optical depth of the dust clouds, and investigate what effects it may have on the shape of the pre-ingress brightening and on the wavelength dependence of the transit depth.
4.3. The composition of the dust and the planets
Applying the above grain size constraints to the results from Sect. 3.2 allows us to exclude some of the solutions seen in Fig. 6. Specifically, the silicate minerals that reproduce the observed tail length of KIC 1255b at very large grain sizes now seem unlikely. The same holds for SiO in the case of KOI-2700b.
One of the remaining candidates for the dust material is corundum (Al2O3). It yields the observed tail lengths of both KIC 1255b and KOI-2700b at plausible grain sizes. Because of the relatively low cosmic abundance of aluminium, it may seem unlikely that a minor species such as corundum accounts for all the dust in the tails of the evaporating planets. However, as already noted by Rappaport et al. (2012), high Al2O3 abundances can be created by a distillation of the planetary surface. This mechanism was proposed by Léger et al. (2011) in a study of the lava ocean which is thought to dominate the dayside surface of the hot super-Earth CoRoT-7b. Starting with a silicate composition, more volatile elements such as Si, Fe, and Mg evaporate preferentially from the lava ocean, and, if these components leave the system permanently, the ocean over time consists of increasingly refractory species. After about 1.5 Gyr of steady evaporation, the ocean reaches a stable composition of 13% CaO and 87% Al2O3. A similar distillation scenario for KIC 1255b and KOI-2700b may explain the prevalence of corundum grains.
Previous work on the evaporating exoplanet candidates proposed pyroxene ([Mg,Fe]SiO3) as the main constituent of the dust in the tails, and (in the case of KIC 1255b) rejected olivine ([Mg,Fe]2SiO4) as too volatile (Rappaport et al. 2012, 2014). These suggestions are based on scaling the sublimation time scales found by Kimura et al. (2002) for cometary dust grains in the vicinity of the Sun to the exoplanetary systems. Here, we show that dust grains made of enstatite (the Mg-rich end-member of pyroxene) survive for too long to explain the observed tail lengths5. Regarding olivine, the Mg-rich end-member forsterite behaves similar to enstatite, while the Fe-rich end-member fayalite gives much shorter tails. For KOI-2700b, the observed tail length is consistent with dust grains composed of fayalite, while for KIC 1255b fayalite is too volatile. Since these two end-members of olivine give tail lengths on opposite sides of the observed value for KIC 1255b, it is conceivable that an intermediate form (iron-rich, but with some magnesium) yields the right length.
The list of dust materials we tested is far from exhaustive. In addition, we only considered dust grains of a single, pure composition. This type of investigation only allows one to test whether a dust species is consistent with the observations or not, and there may be more dust species, different from the ones we found, that can also explain the data. Perhaps the most stringent constraint resulting from this work is that pure iron and carbonaceous dust compositions are not favoured.
Broadly speaking, the composition of the dust ejected by evaporating planets reflects that of the parent planet. Hence, pure iron and carbonaceous compositions are not favoured for the planets KIC 1255b and KOI-2700b. However, the relation between dust and planet composition may be complicated by processes such as preferential condensation of certain species and fractionation of a lava ocean (Léger et al. 2011). Therefore, to gain more insight into the planetary composition, a thorough investigation of the link between planet and dust composition is required. Roughly, this would entail the following modelling steps: (1) Given a planetary composition, temperature, and gravity, calculate the composition of the atmosphere resulting from evaporation (e.g., Schaefer & Fegley 2009; Miguel et al. 2011; Schaefer et al. 2012). (2) Determine the dynamical structure of the atmospheric outflow (see Perez-Becker & Chiang 2013). (3) Calculate which dust species would condensate in this outflow (as has been done for stellar outflows; e.g., Gail 2010)6. By doing this for different potential planetary compositions, and as a function of temperature and gravity, it may be possible to use the dust composition as a probe for the composition of the planet.
5. Conclusions
This paper describes the decay of cross-section in dusty tails trailing evaporating planets, such as KIC 1255b and KOI-2700b. The analytical expression we derive (Eq. (18)) can be used to model transit light curves. Specifically, it provides a physical interpretation for two properties of a dust tail. The density of the tail (found from the transit depth) is related to the mass loss rate of theplanet. The tail length (which can be derived from the duration of the transit) is determined by the sublimation rate of the dust in the tail. This sublimation rate depends sensitively on the optical and thermodynamical properties of the material that the dust grains in the tail are made of. Therefore, given accurate laboratory measurements of these properties, the tail length can be used to constrain the composition of the dust.
The constraints we find for the dust composition of the two evaporating exoplanet candidates are summarised in Table 5. Our analysis has lead to the following conclusions about these systems:
-
1.
The mass loss rate in dust of KIC 1255b is ap-proximately Ṁd ≈ 1.7 ± 0.5 M⊕ Gyr-1. For KOI-2700b, we find a 1σ lower limit of Ṁd ≳ 0.007 M⊕ Gyr-1.
-
2.
Dust grains composed of corundum can explain the tail lengths of both candidates.
-
3.
The tail length of KOI-2700b is also consistent with a fayalite composition. A composition of iron-rich silicate minerals may also work for KIC 1255b.
-
4.
Dust grains made of pure iron, graphite, or silicon carbide are not favoured for both objects.
For both stars, we use model atmospheres with an effective temperature of Teff,⋆ = 4500 K and a surface gravity of log g = 4.5, compatible with the stellar parameters given by Huber et al. (2014).
More precisely, μ should reflect the average molecular weight of the molecules recondensing from the gas phase in an equilibrium between sublimation and condensation. For simplicity, we use the molecular weights of the dust compound. Discrepancies may result in errors of the order of unity in the final value of J, which are negligible compared to the uncertainties on α and pv.
The two equations are identical to first order at Δθ = 0, and, for a large exponent, Eq. (19a)approaches exponential decay (cf. Rappaport et al. 2014, and see their Fig. 12): 
I.e.,  , where
  is the angle subtended by the chord (see Fig. 4 of Brogi et al. 2012).
We only considered crystalline minerals, because amorphous forms are expected to transition to crystalline on timescales much shorter than the sublimation timescale (see Sect. 4.2.3 of Kimura et al. 2002).
This assumes that the outflow is loaded with dust grains as a result of condensation from the gas phase. Another possible origin of the dust is explosive vulcanism (see Sect. 4.2 of Rappaport et al. 2012, and references therein).
Acknowledgments
We thank H.-P. Gail for sharing refractive index data of SiO. We also appreciate the constructive comments of an anonymous referee.
References
- Brogi, M., Keller, C. U., de Juan Ovelar, M., et al. 2012, A&A, 545, L5 [NASA ADS] [CrossRef] [EDP Sciences] [Google Scholar]
- Budaj, J. 2013, A&A, 557, A72 [NASA ADS] [CrossRef] [EDP Sciences] [Google Scholar]
- Burns, J. A., Lamy, P. L., & Soter, S. 1979, Icarus, 40, 1 [NASA ADS] [CrossRef] [Google Scholar]
- Croll, B., Rappaport, S., DeVore, J., et al. 2014, ApJ, 786, 100 [NASA ADS] [CrossRef] [Google Scholar]
- Dorschner, J., Begemann, B., Henning, T., Jaeger, C., & Mutschke, H. 1995, A&A, 300, 503 [NASA ADS] [Google Scholar]
- Draine, B. T., & Lee, H. M. 1984, ApJ, 285, 89 [Google Scholar]
- Fabian, D., Henning, T., Jäger, C., et al. 2001, A&A, 378, 228 [NASA ADS] [CrossRef] [EDP Sciences] [MathSciNet] [Google Scholar]
- Ferguson, F. T., Nuth, J. A., & Johnson, N. M. 2004, J. Chem. Eng. Data, 49, 497 [Google Scholar]
- Gail, H.-P. 2010, in Lect. Notes Phys. 815 (Berlin: Springer Verlag), ed. T. Henning, 61 [Google Scholar]
- Gail, H.-P., Wetzel, S., Pucci, A., & Tamanai, A. 2013, A&A, 555, A119 [NASA ADS] [CrossRef] [EDP Sciences] [Google Scholar]
- Hashimoto, A. 1990, Nature, 347, 53 [NASA ADS] [CrossRef] [Google Scholar]
- Huber, D., Silva Aguirre, V., Matthews, J. M., et al. 2014, ApJS, 211, 2 [NASA ADS] [CrossRef] [Google Scholar]
- Jaeger, C., Molster, F. J., Dorschner, J., et al. 1998, A&A, 339, 904 [NASA ADS] [Google Scholar]
- Kawahara, H., Hirano, T., Kurosaki, K., Ito, Y., & Ikoma, M. 2013, ApJ, 776, L6 [NASA ADS] [CrossRef] [Google Scholar]
- Kimura, H., Mann, I., Biesecker, D. A., & Jessberger, E. K. 2002, Icarus, 159, 529 [NASA ADS] [CrossRef] [Google Scholar]
- Koch, D. G., Borucki, W. J., Basri, G., et al. 2010, ApJ, 713, L79 [NASA ADS] [CrossRef] [Google Scholar]
- Koike, C., Kaito, C., Yamamoto, T., et al. 1995, Icarus, 114, 203 [NASA ADS] [CrossRef] [Google Scholar]
- Kurucz, R. 1993, ATLAS9 Stellar Atmosphere Programs and 2 km s-1 grid. Kurucz CD-ROM No. 13. Cambridge, Mass.: Smithsonian Astrophysical Observatory, 13 [Google Scholar]
- Kushiro, I., & Mysen, B. O. 1991, in Prog. in metamorphic and magmatic petrology: a memorial volume in honour of D. S. Korzhinskiy, ed. L. L. Perchuk (Cambridge: Cambridge University Press), 411 [Google Scholar]
- Lamy, P. L. 1974, A&A, 35, 197 [NASA ADS] [Google Scholar]
- Langmuir, I. 1913, Phys. Rev., 2, 329 [Google Scholar]
- Laor, A., & Draine, B. T. 1993, ApJ, 402, 441 [NASA ADS] [CrossRef] [Google Scholar]
- Léger, A., Grasset, O., Fegley, B., et al. 2011, Icarus, 213, 1 [NASA ADS] [CrossRef] [Google Scholar]
- Lihrmann, J.-M. 2008, J. Eur. Ceram. Soc., 28, 649 [Google Scholar]
- Lilov, S. 1993, Materials Science and Engineering: B, 21, 65 [Google Scholar]
- Mie, G. 1908, Ann. Phys., 330, 377 [Google Scholar]
- Miguel, Y., Kaltenegger, L., Fegley, B., & Schaefer, L. 2011, ApJ, 742, L19 [NASA ADS] [CrossRef] [Google Scholar]
- Mysen, B. O., & Kushiro, I. 1988, Am. Mineral., 73, 1 [Google Scholar]
- Nagahara, H., Mysen, B. O., & Kushiro, I. 1994, Geochim. Cosmochim. Acta, 58, 1951 [NASA ADS] [CrossRef] [Google Scholar]
- Ordal, M. A., Bell, R. J., Alexander, R. W., Newquist, L. A., & Querry, M. R. 1988, Appl. Opt., 27, 1203 [NASA ADS] [CrossRef] [PubMed] [Google Scholar]
- Palik, E. D. 1985, Handbook of optical constants of solids (New York: Academic Press) [Google Scholar]
- Perez-Becker, D., & Chiang, E. 2013, MNRAS, 433, 2294 [NASA ADS] [CrossRef] [Google Scholar]
- Rappaport, S., Levine, A., Chiang, E., et al. 2012, ApJ, 752, 1 [NASA ADS] [CrossRef] [Google Scholar]
- Rappaport, S., Barclay, T., DeVore, J., et al. 2014, ApJ, 784, 40 [NASA ADS] [CrossRef] [Google Scholar]
- Schaefer, L., & Fegley, B. 2004, Icarus, 169, 216 [NASA ADS] [CrossRef] [Google Scholar]
- Schaefer, L., & Fegley, B. 2009, ApJ, 703, L113 [NASA ADS] [CrossRef] [Google Scholar]
- Schaefer, L., Lodders, K., & Fegley, B. 2012, ApJ, 755, 41 [NASA ADS] [CrossRef] [Google Scholar]
- van Werkhoven, T. I. M., Brogi, M., Snellen, I. A. G., & Keller, C. U. 2014, A&A, 561, A3 [NASA ADS] [CrossRef] [EDP Sciences] [Google Scholar]
- Wetzel, S., Klevenz, M., Gail, H.-P., Pucci, A., & Trieloff, M. 2013, A&A, 553, A92 [NASA ADS] [CrossRef] [EDP Sciences] [Google Scholar]
- Zavitsanos, P. D., & Carlson, G. A. 1973, The J. Chem. Phys., 59, 2966 [NASA ADS] [CrossRef] [Google Scholar]
- Zeidler, S., Posch, T., Mutschke, H., Richter, H., & Wehrhan, O. 2011, A&A, 526, A68 [NASA ADS] [CrossRef] [EDP Sciences] [Google Scholar]
- Zeidler, S., Posch, T., & Mutschke, H. 2013, A&A, 553, A81 [NASA ADS] [CrossRef] [EDP Sciences] [Google Scholar]
All Tables
Bulk densities and sources for optical properties of the dust species considered in this study.
Constraints on the dust tail cross-section distribution parameters derived from transit light curve fitting.
All Figures
|
Fig. 1 Diagrams of the path followed by a dust grain released from an evaporating planet (ignoring sublimation of the dust grain) for 3 orbital periods of the planet, in the inertial frame and in the frame corotating with the planet. The positions of the planet and the dust particle are indicated at a time 1.6 orbital periods of the planet after release. |
| In the text | |
|
Fig. 2 Wavelength-averaged extinction efficiency |
| In the text | |
|
Fig. 3 Radiation pressure to gravitational force ratio β as a function of grain radius s for KIC 1255b. Different colours correspond to the materials listed in Table 2. Uncertainties (due to uncertainties in stellar parameters) are indicated by the error bar in the bottom left. The same figure for KOI-2700b is qualitatively the same, but the β values are lower by a factor of about 1.5. |
| In the text | |
|
Fig. 4 Dust temperatures Td at the orbital distance of the planet as a function of grain radius s for various dust materials. The horizontal black lines mark the black-body temperatures at the distances of the planets. The grey bands indicate the uncertainties on the black-body temperatures, and can be used as estimates of the typical uncertainties on the grain temperatures. |
| In the text | |
|
Fig. 5 Mass loss flux as a function of temperature (Eq. (12)) for different materials, whose properties are listed in Table 3. Typical uncertainties (in temperature) are indicated by the error bars next to the legend. The horizontal lines mark the sublimation rates required to explain the observed tail lengths (Eq. (22)), with light grey bands indicating their uncertainties. The black-body temperatures (Eq. (16)) at the distance of the planets and their uncertainties are indicated by vertical line segments and dark grey patches. |
| In the text | |
|
Fig. 6 Characteristic angle of the tail’s decay as a function of grain size (Eq. (19c)) for KIC 1255b and KOI-2700b, with different colours for different materials. Dashed lines indicate that particles sublimate entirely before completing one orbit. Gaps (neither a solid nor a dashed line) appear where particles are unbound (β ≥ 0.5). Typical uncertainties are shown by the error bars at the bottom of each panel. The horizontal black lines indicate the values of Δθtail derived from the observed light curves. |
| In the text | |
|
Fig. 7 Angular separation between dust grains and the planet KIC 1255b as a function of time for different values of β (the ratio of radiation pressure to gravitational force on a dust grain). The horizontal grey line indicates the position of the tentative flux decrement in the egress with respect to the midpoint of the transit. |
| In the text | |
Current usage metrics show cumulative count of Article Views (full-text article views including HTML views, PDF and ePub downloads, according to the available data) and Abstracts Views on Vision4Press platform.
Data correspond to usage on the plateform after 2015. The current usage metrics is available 48-96 hours after online publication and is updated daily on week days.
Initial download of the metrics may take a while.