Fig. 9
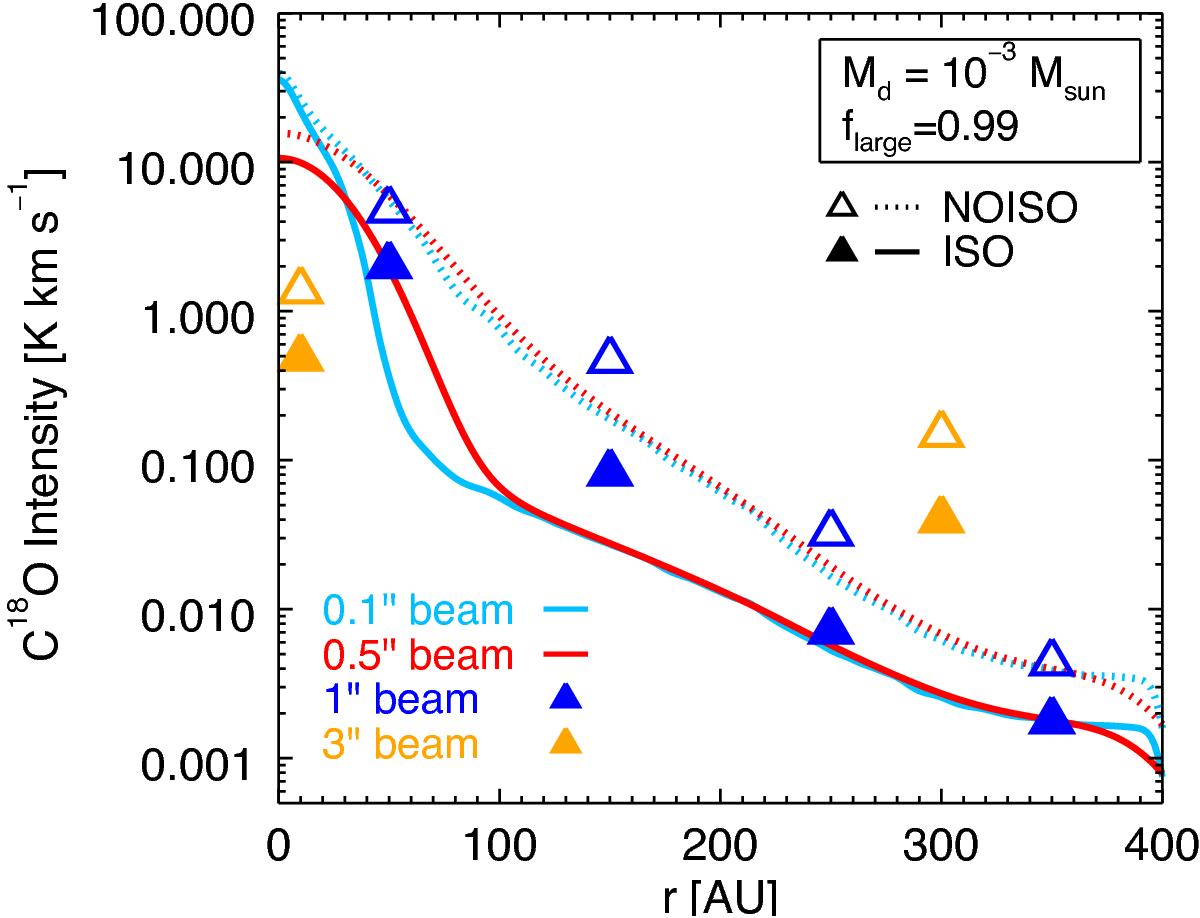
Radial profiles of the C18O line intensity (J = 3−2) considering different observational beams for a particular disk model (T Tauri star, Mdisk = 10-3M⊙,fsmall = 0.99). Different colors show different choices of the observational beam size. Solid lines represent the intensities obtained considering the isotope-selective processes (ISO network), dotted lines show the results when an approximative analysis is carried out (NOISO network). For the 0.1′′ and 0.5′′ beam, full lines are presented, whereas for the 1′′ and 3′′ beam they are binned at the spatial resolution. For the 3′′ beam, only the disk-integrated value (or the value that just resolves the outer disk) is shown.
Current usage metrics show cumulative count of Article Views (full-text article views including HTML views, PDF and ePub downloads, according to the available data) and Abstracts Views on Vision4Press platform.
Data correspond to usage on the plateform after 2015. The current usage metrics is available 48-96 hours after online publication and is updated daily on week days.
Initial download of the metrics may take a while.