Fig. 8
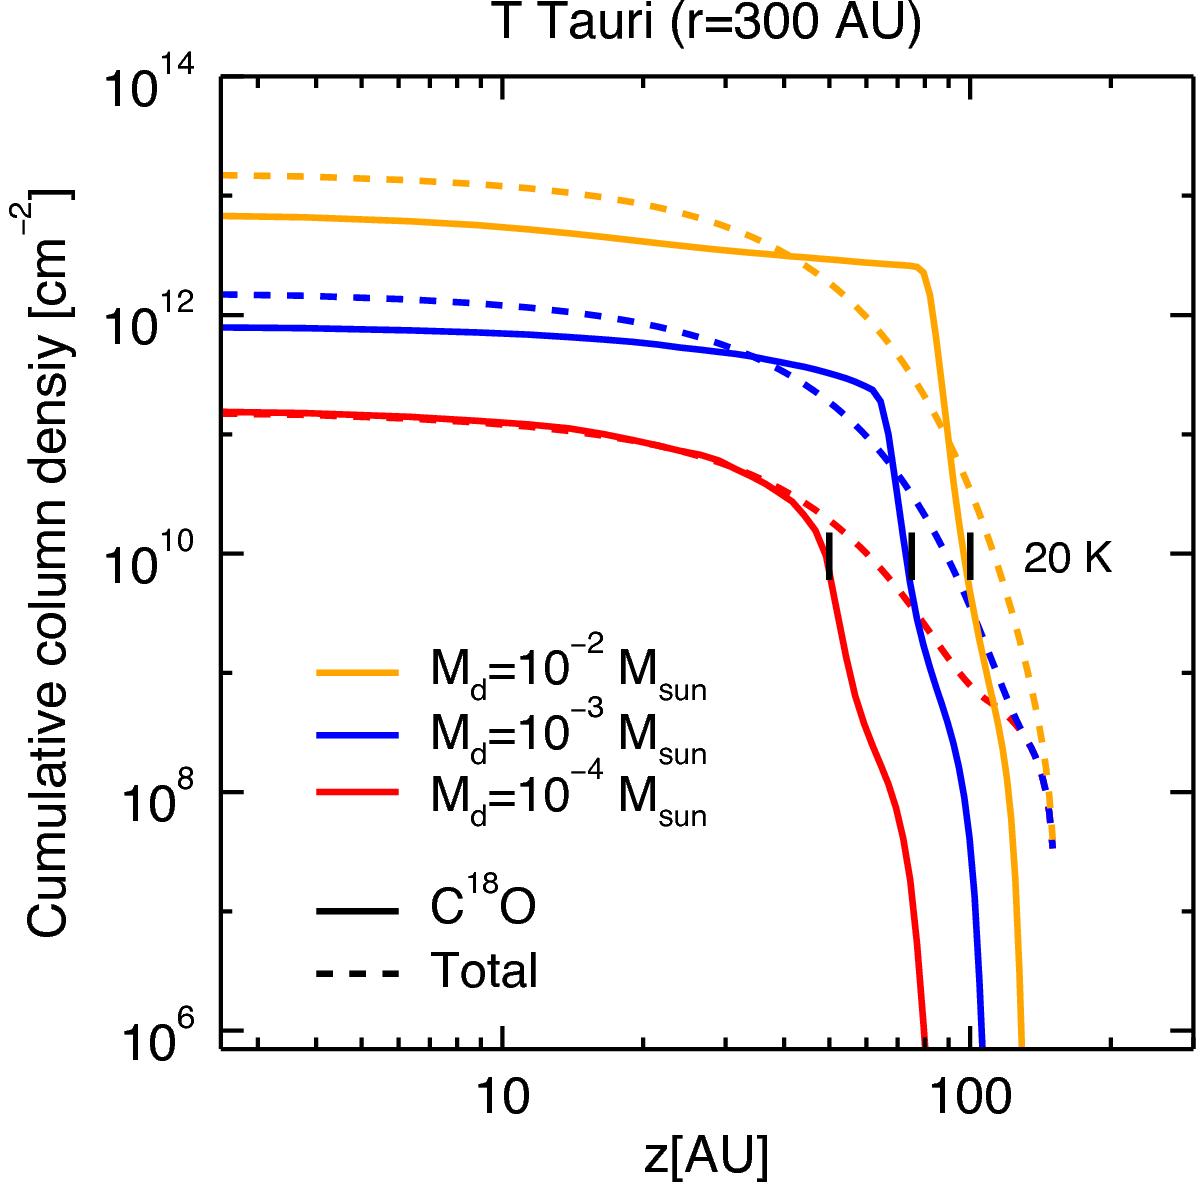
Cumulative column density as a function of the disk height integrating from the surface to the midplane in a disk radial cut (r = 300 AU). Only T Tauri models with flarge = 0.99 are shown. Different line colors represent models with various disk masses. Dotted lines show the scaled total gas cumulative column density (see text), solid lines that of C18O. The black lines show where the dust temperature is lower than 20 K for the different disk models, i.e., where CO freeze-out becomes important.
Current usage metrics show cumulative count of Article Views (full-text article views including HTML views, PDF and ePub downloads, according to the available data) and Abstracts Views on Vision4Press platform.
Data correspond to usage on the plateform after 2015. The current usage metrics is available 48-96 hours after online publication and is updated daily on week days.
Initial download of the metrics may take a while.