Fig. 6
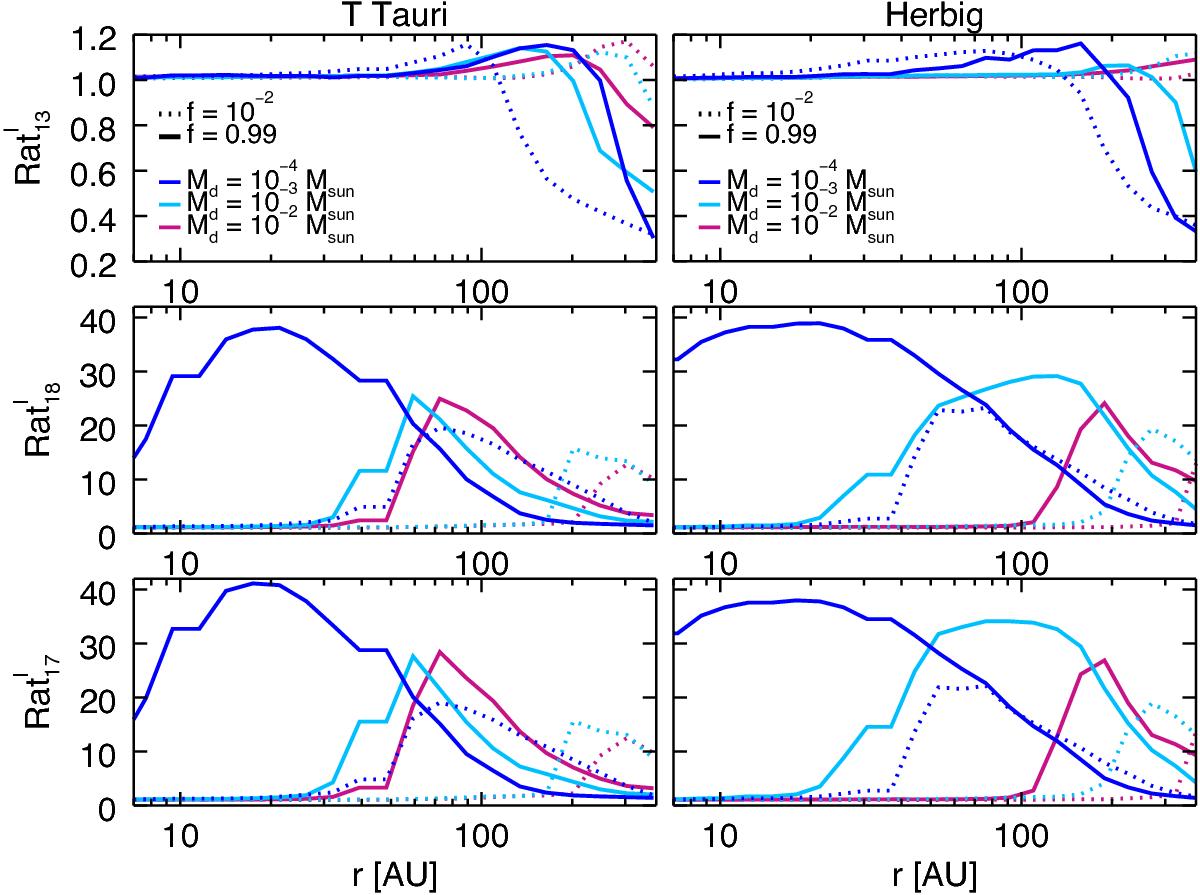
Ratios of CO isotopologue line intensity (J = 3−2) obtained
with the NOISO and ISO networks as a function of the disk radius.
![]() /I [ 13CO ]
ISO,
/I [ 13CO ]
ISO, ![]() /I [ C18O ]
ISO and
/I [ C18O ]
ISO and ![]() /I [ C17O ]
ISO were defined. Dotted lines refer to models where
f =
10-2, solid lines to flarge =
0.99. Different colors indicate models with different disk
masses: Md =
10-4M⊙ in blue,
Md =
10-3M⊙ in light blue and
Md =
10-2M⊙ in purple. Models
with T Tauri stars are shown in the left panels, those with Herbig
stars in the right panels.
/I [ C17O ]
ISO were defined. Dotted lines refer to models where
f =
10-2, solid lines to flarge =
0.99. Different colors indicate models with different disk
masses: Md =
10-4M⊙ in blue,
Md =
10-3M⊙ in light blue and
Md =
10-2M⊙ in purple. Models
with T Tauri stars are shown in the left panels, those with Herbig
stars in the right panels.
Current usage metrics show cumulative count of Article Views (full-text article views including HTML views, PDF and ePub downloads, according to the available data) and Abstracts Views on Vision4Press platform.
Data correspond to usage on the plateform after 2015. The current usage metrics is available 48-96 hours after online publication and is updated daily on week days.
Initial download of the metrics may take a while.