Fig. 5
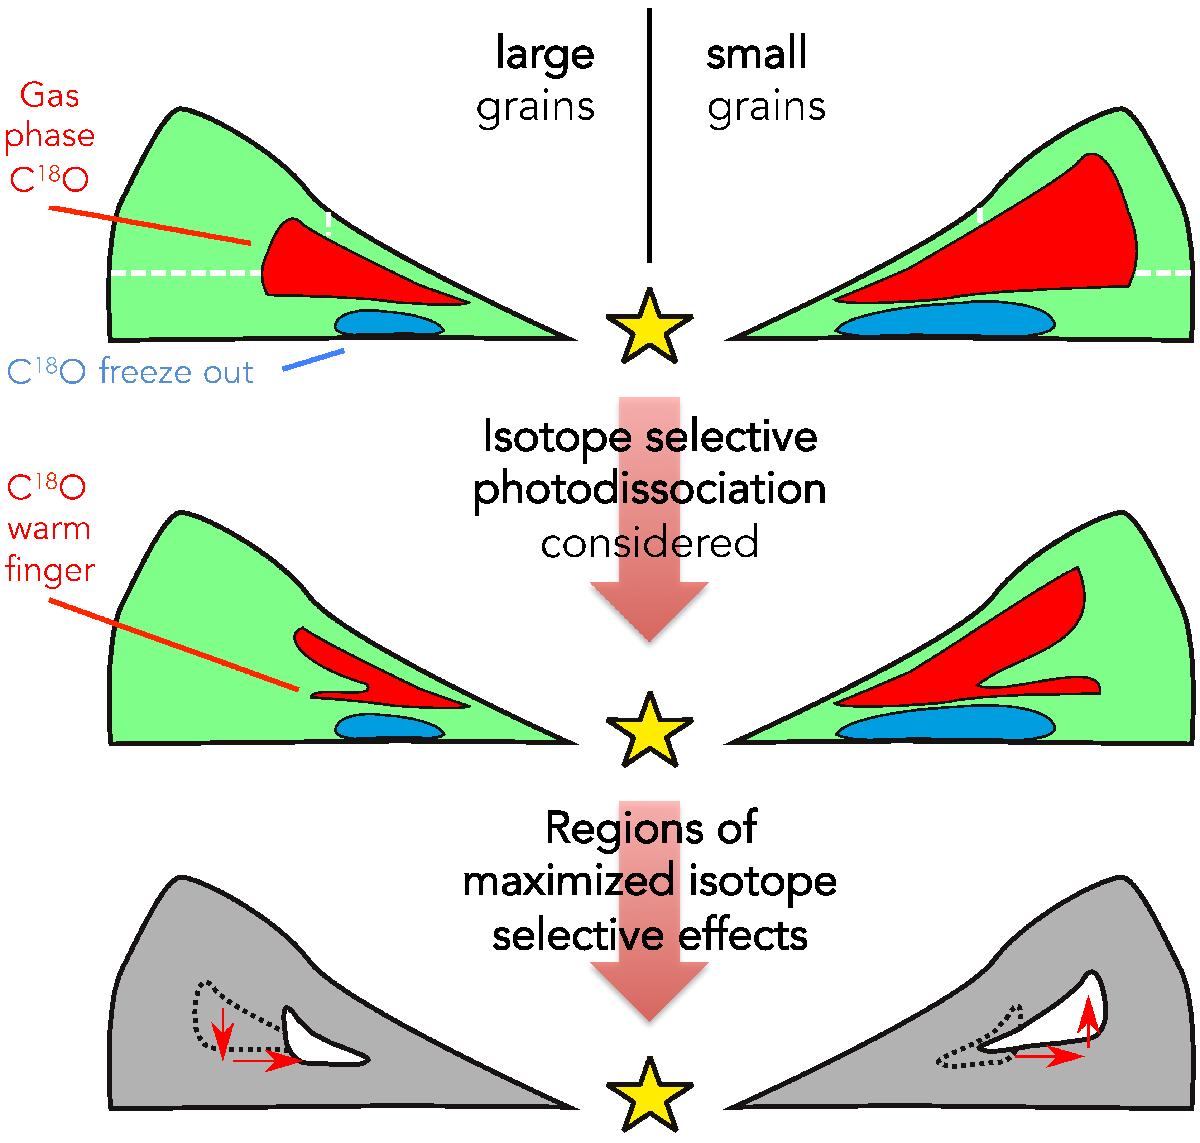
Sketch of the 2D abundances of C18O in one quadrant of the disk. On the left-hand side mm-sized grains are present in the disk (flarge = 0.99), while on the right just (sub) μm-sized grains are considered (flarge = 10-2). In the upper panel the 2D abundance predicted by the NOISO network (i.e., not considering isotope selective photodissociation) is plotted, in the middle panel that inferred by the ISO network, i.e., with an isotopologue selective treatment of isotopologues. The red regions show where CO isotopologues are in the molecular phase, while the blue regions are where they are frozen onto grains. The regions where the two predictions differ more are those in which isotope-selective processes are strongest; they are highlighted in the lower panel by the white shapes. The black dotted contours and the red arrows show the difference between ISO and NOISO. Since small grains are more efficient in shielding from photodissociating photons, C18O can survive in the gas phase at grater heights and farther out (white dotted lines in the upper panel). Accordingly, the white regions that show the difference between ISO and NOISO in the lower panel also shift upward and outward in the case of small grains.
Current usage metrics show cumulative count of Article Views (full-text article views including HTML views, PDF and ePub downloads, according to the available data) and Abstracts Views on Vision4Press platform.
Data correspond to usage on the plateform after 2015. The current usage metrics is available 48-96 hours after online publication and is updated daily on week days.
Initial download of the metrics may take a while.