Fig. 2
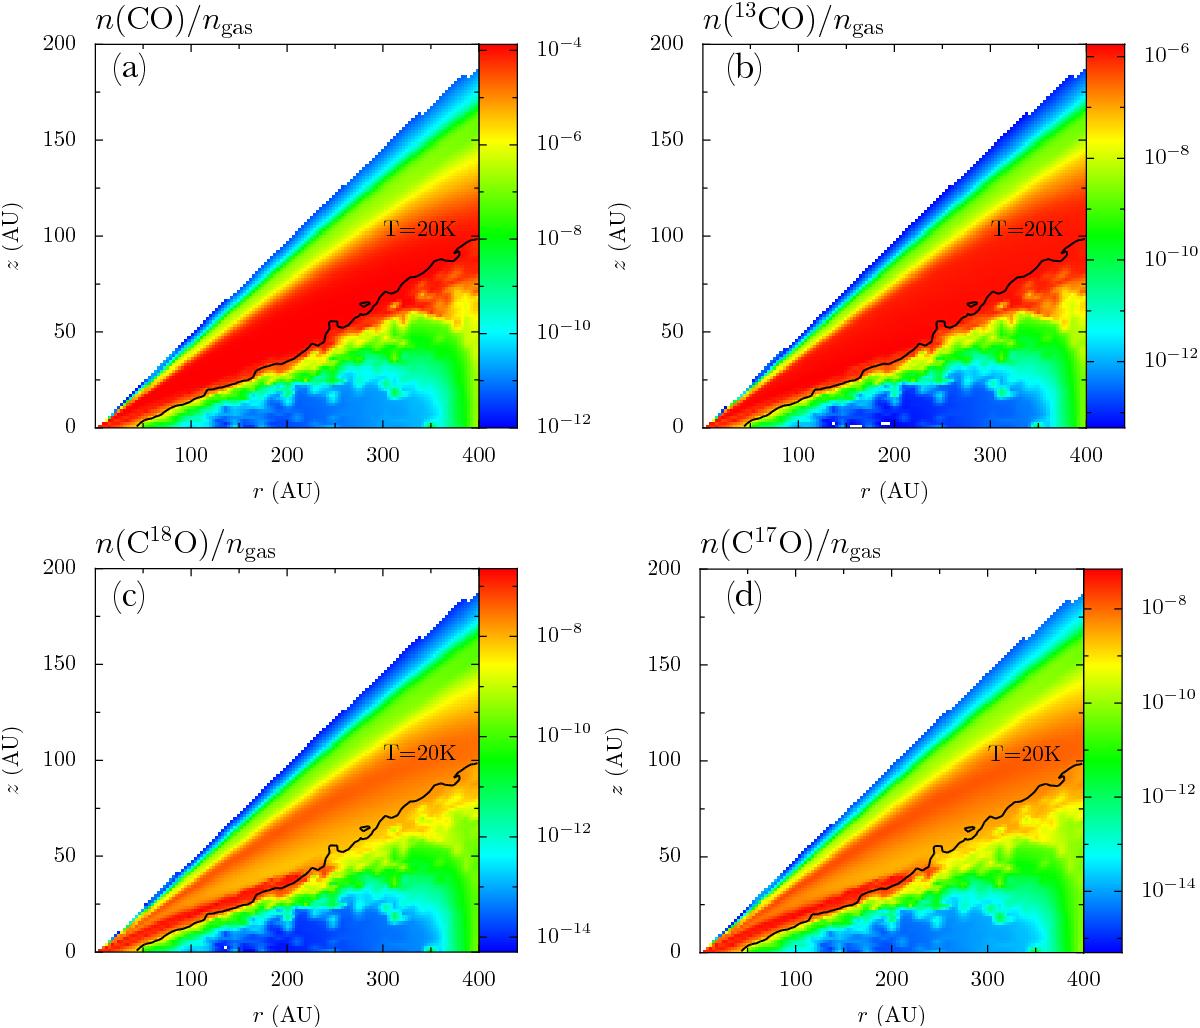
2D representations of the results obtained including isotope-selective effects for a representative model (Md = 10-2M⊙, T Tauri star, flarge = 10-2). The CO isotopologue abundances normalized to the total gas density are presented. The black solid line indicates the layer where the dust temperature is equal to 20 K. For lower Tdust values, CO freeze-out may become important.
Current usage metrics show cumulative count of Article Views (full-text article views including HTML views, PDF and ePub downloads, according to the available data) and Abstracts Views on Vision4Press platform.
Data correspond to usage on the plateform after 2015. The current usage metrics is available 48-96 hours after online publication and is updated daily on week days.
Initial download of the metrics may take a while.