Fig. 10
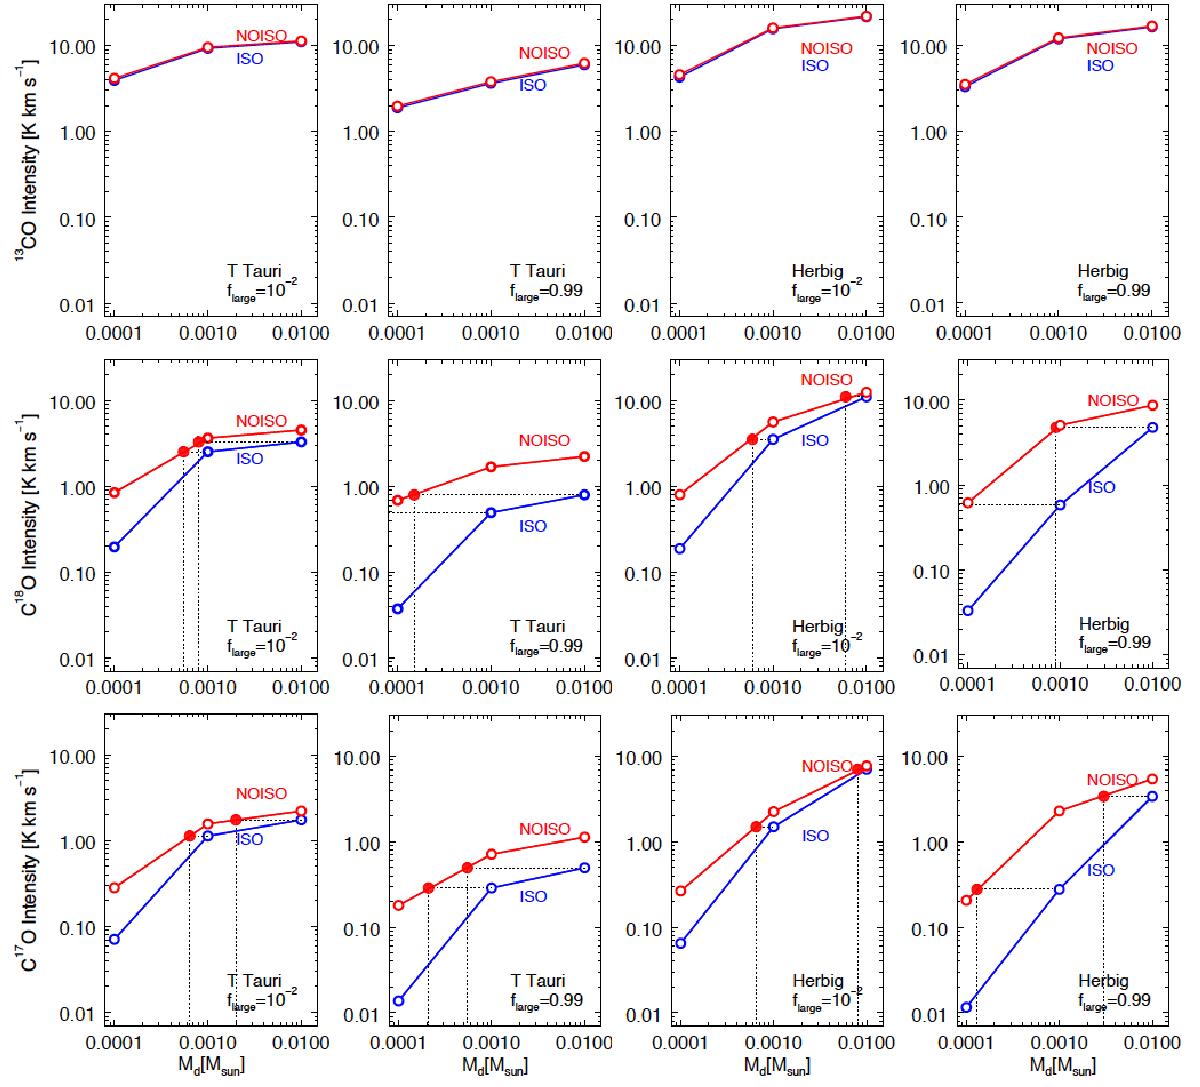
Disk-integrated 13CO (top), C18O (middle), and C17O (bottom) line intensities (J = 3−2) obtained with disk masses Md = 10-4,10-3,10-2M⊙ are shown as a function of the disk mass. The beam size is 3′′. The red line relates the intensity values obtained for the three disk masses with the NOISO network, while the blue line shows those with the ISO network. Dotted lines indicate by which factor the total disk mass is underestimated if no isotope-selective processes are considered. Results are presented for flarge = 10-2, 0.99 and for T Tauri and Herbig disks.
Current usage metrics show cumulative count of Article Views (full-text article views including HTML views, PDF and ePub downloads, according to the available data) and Abstracts Views on Vision4Press platform.
Data correspond to usage on the plateform after 2015. The current usage metrics is available 48-96 hours after online publication and is updated daily on week days.
Initial download of the metrics may take a while.