Fig. 9
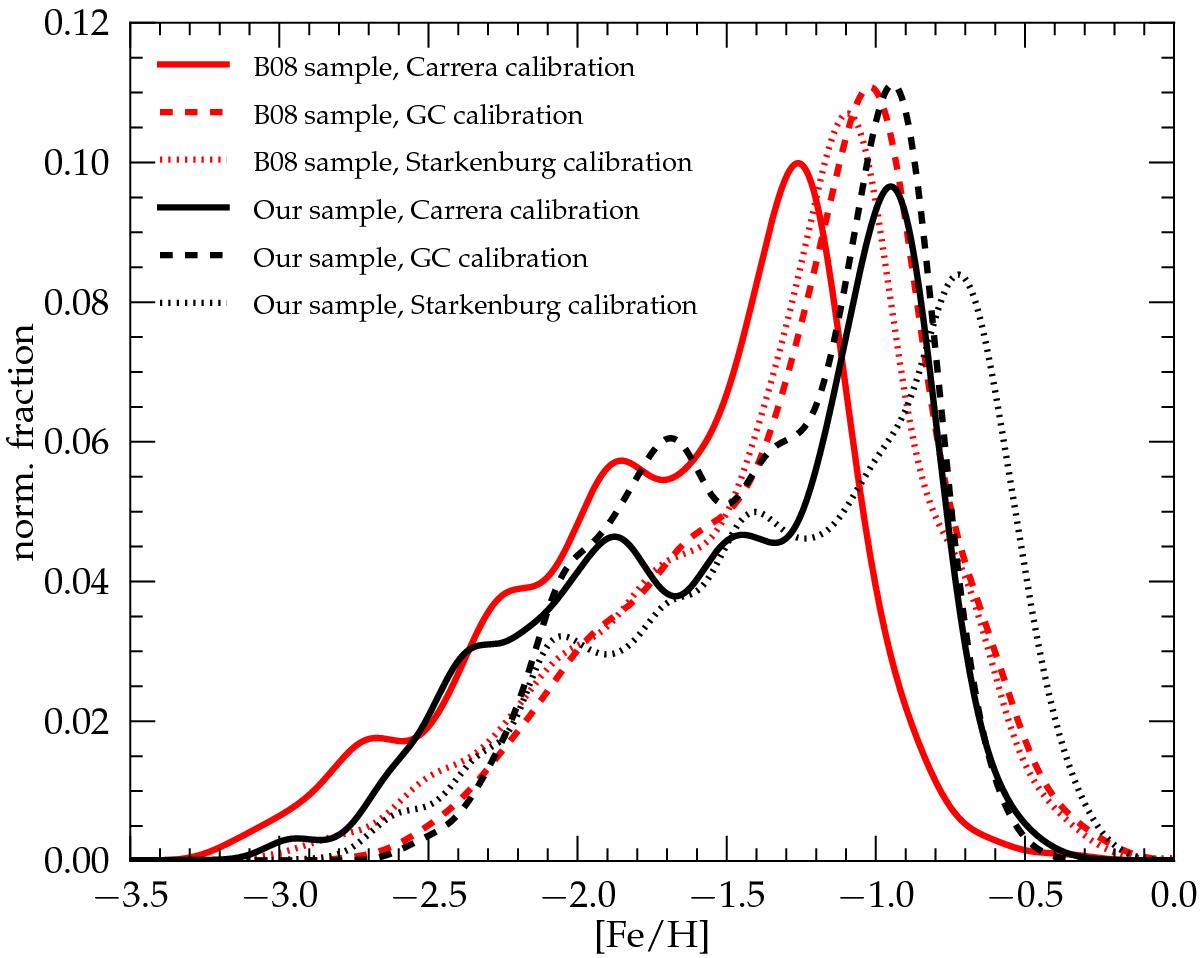
Comparison between different CaT-[Fe/H] calibrations applied to two independent datasets. The B08-sample (see text) has been analyzed with an empirical correction to a Gaussian fit, whereas our EWs have been determined from a combined Gaussian and Lorentzian function. With respect to the position of the prominent peak in the distribution, a good agreement for the zero-point in [Fe/H] between both sets is obtained when the line-fitting technique in the calibration relation and the scientific sample is the same. In contrast, different line-fitting approaches can result in significant offsets of more than 0.5 dex between the samples.
Current usage metrics show cumulative count of Article Views (full-text article views including HTML views, PDF and ePub downloads, according to the available data) and Abstracts Views on Vision4Press platform.
Data correspond to usage on the plateform after 2015. The current usage metrics is available 48-96 hours after online publication and is updated daily on week days.
Initial download of the metrics may take a while.