Fig. 8
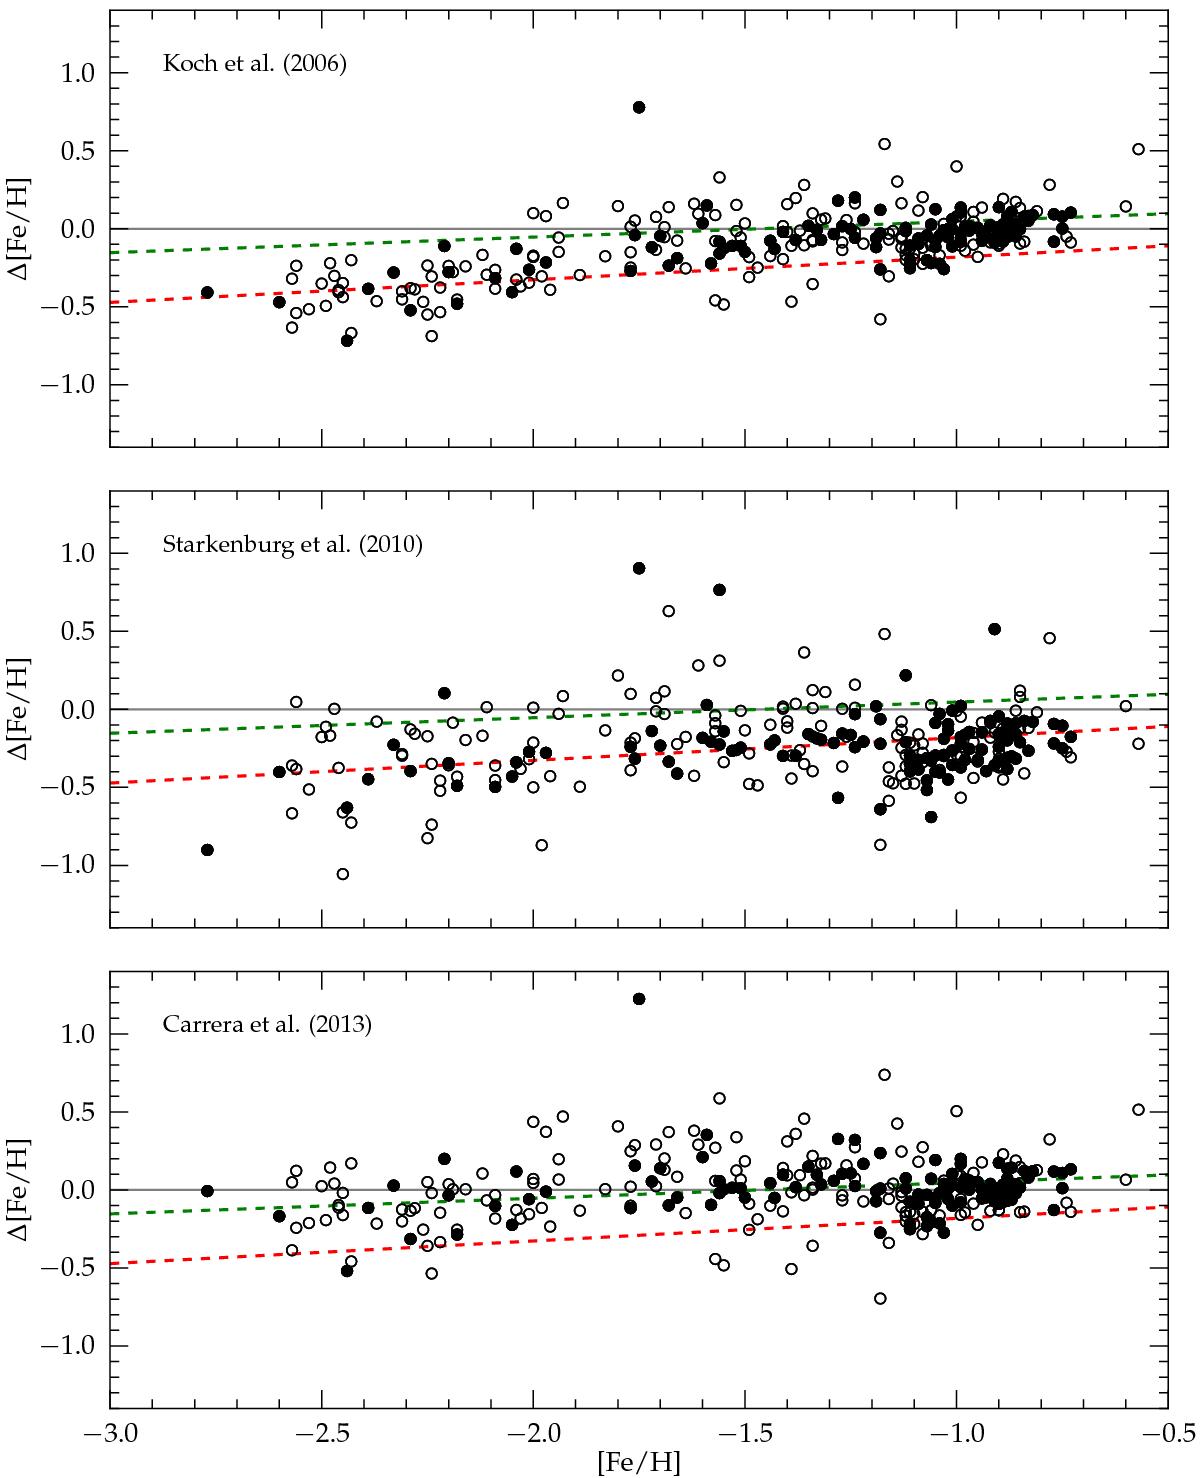
Comparison of different CaT-[Fe/H] calibrations to independent Fe-abundances from iron-line analysis for the same sample of stars. In each panel Δ [Fe/H] = Fe − CaT. We show the results for our complete sample in open circles and highlight stars with S/N ≥ 25 and σ [Fe/H] ≤ 0.15 with filled symbols. The red and green dashed line in each panel indicate the best linear fit to the Starkenburg- and Carrera-calibration, respectively, and reveal a constant ~ 0.2 dex-offset between them. The latter one yields a better fit to our data. The classical GC-calibration in the top panel shows a clear systematic trend for [Fe/H] ≤ − 1.8, resulting in CaT-metallicities too metal-rich by as much as 0.5 dex.
Current usage metrics show cumulative count of Article Views (full-text article views including HTML views, PDF and ePub downloads, according to the available data) and Abstracts Views on Vision4Press platform.
Data correspond to usage on the plateform after 2015. The current usage metrics is available 48-96 hours after online publication and is updated daily on week days.
Initial download of the metrics may take a while.