Fig. 7
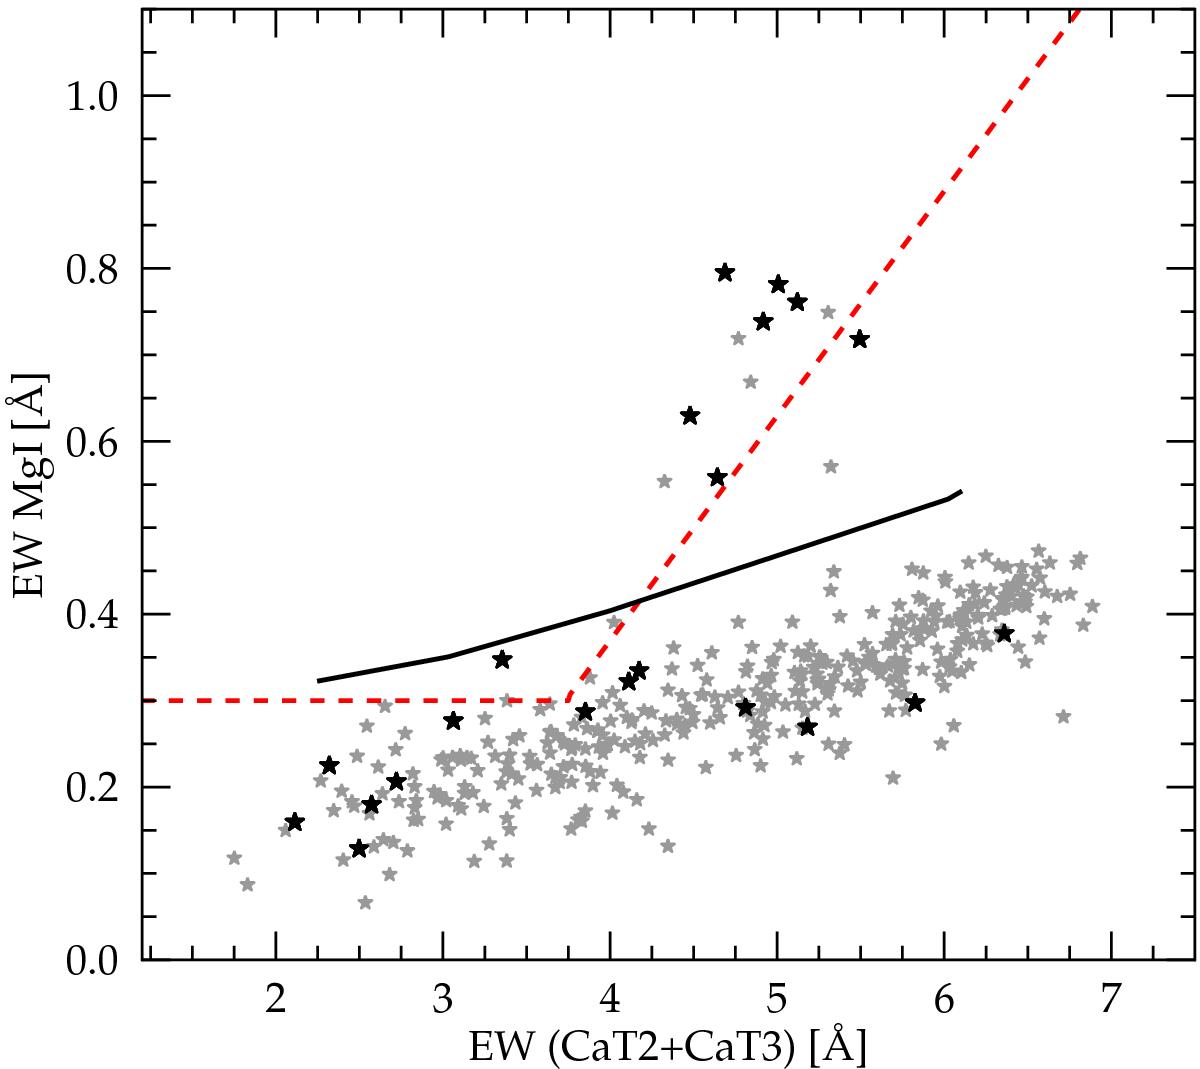
EWs of the two strongest CaT lines in comparison to Mg I at 8806.8 Å. Foreground dwarfs have higher log g and display a stronger Mg-line at given [Fe/H] compared to giant stars. Results from our sample are shown as gray symbols, and stars which previously have been excluded based on their velocities are highlighted in black. The data show a clear sequence of RGB stars with a few (dwarf) foreground contaminants well above the general trend. The separation-criterium from Battaglia & Starkenburg (2012) is indicated as a red dashed line, but does not provide a good cut for our sample. Our own separation limit is indicated as a black solid line and removes only outliers ≥ 0.15 Å above the median Mg line strength at a given CaT EW.
Current usage metrics show cumulative count of Article Views (full-text article views including HTML views, PDF and ePub downloads, according to the available data) and Abstracts Views on Vision4Press platform.
Data correspond to usage on the plateform after 2015. The current usage metrics is available 48-96 hours after online publication and is updated daily on week days.
Initial download of the metrics may take a while.