Fig. 5
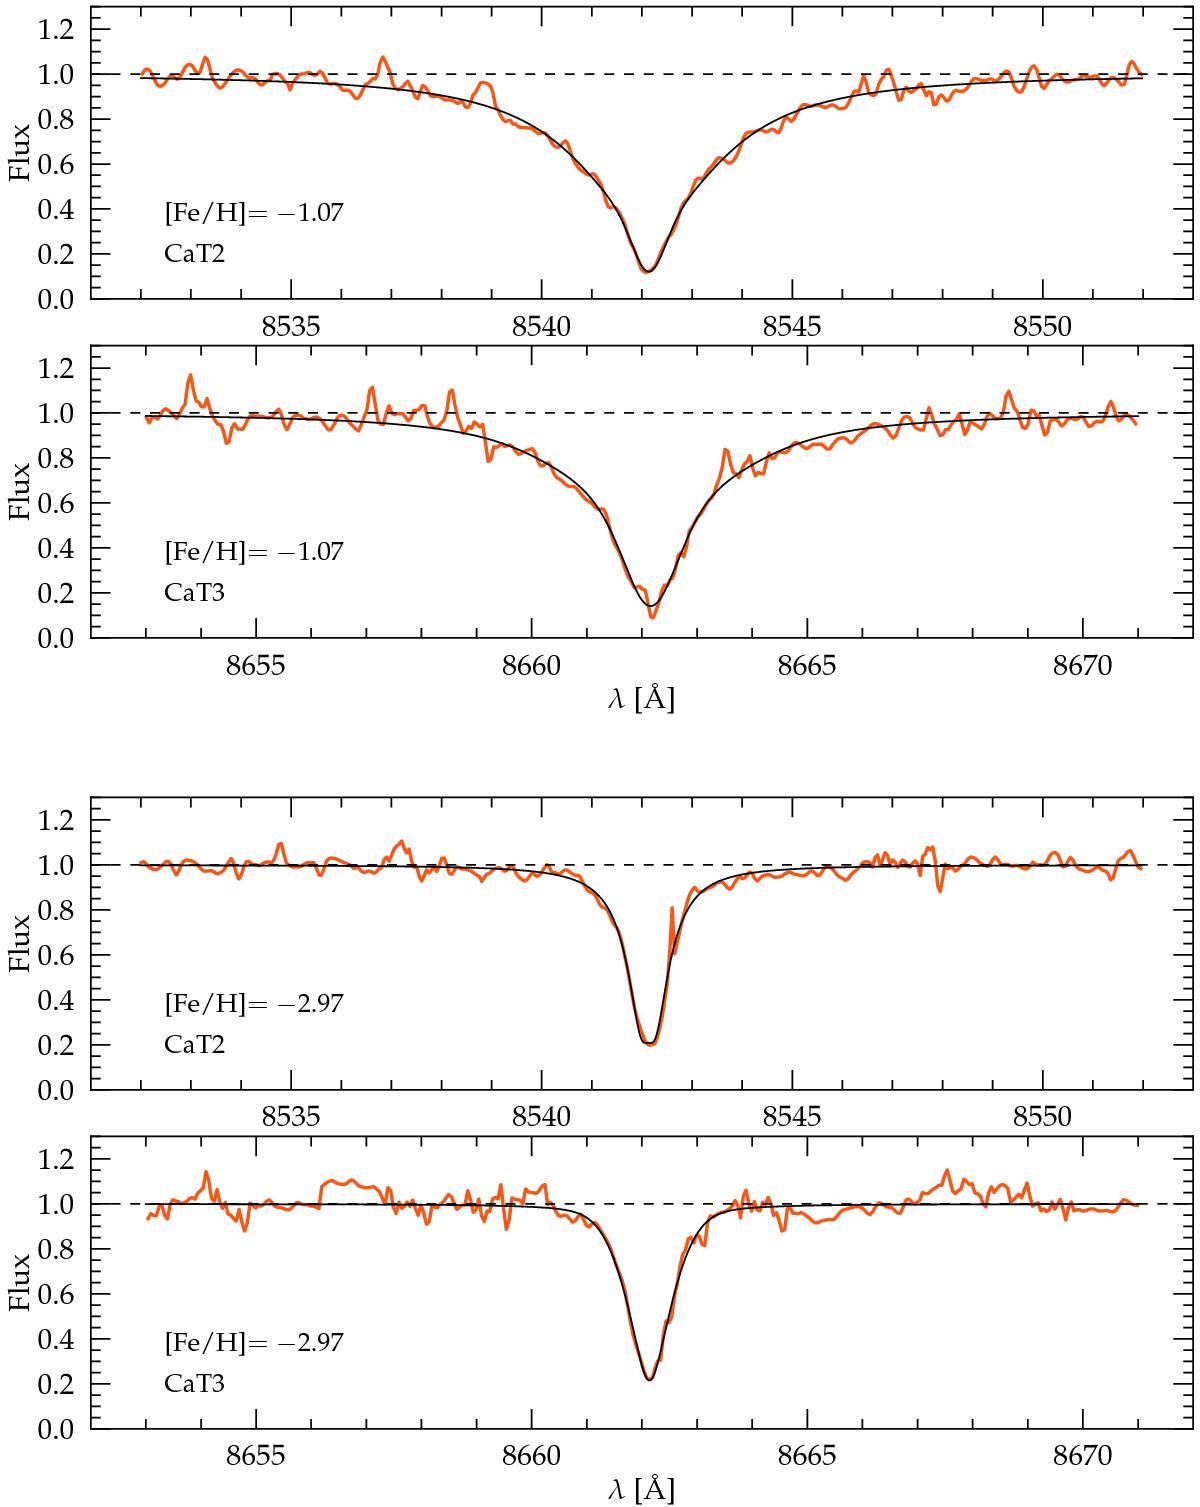
Determination of the EW from the CaT, using continuum-normalized spectra in the case of a metal-rich target (upper two panels) and a metal-poor star (lower two panels). A combination of a Gaussian and a Lorentzian function (black line) is fit to the absorption features in order to account for the strong damping wings, particularly for the metal-rich stars. The plotted wavelength range represents the adopted line bandpasses. The S/N of both targets is ~ 30, a typical value for our sample.
Current usage metrics show cumulative count of Article Views (full-text article views including HTML views, PDF and ePub downloads, according to the available data) and Abstracts Views on Vision4Press platform.
Data correspond to usage on the plateform after 2015. The current usage metrics is available 48-96 hours after online publication and is updated daily on week days.
Initial download of the metrics may take a while.