Fig. 18
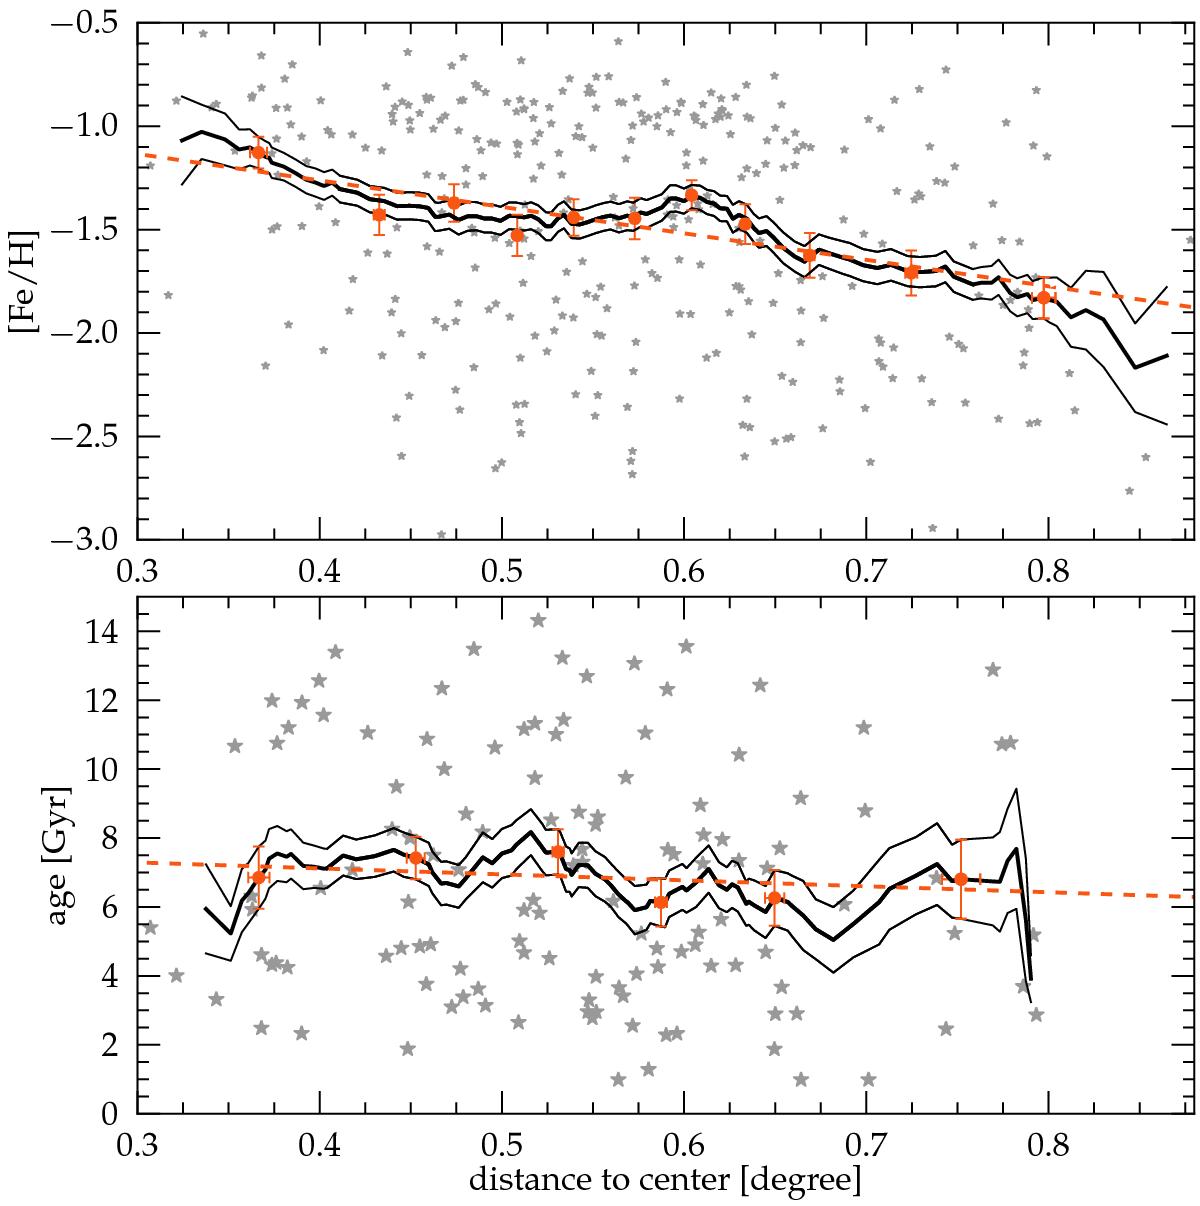
Top: radial metallicity gradient in our sample. The floating mean [Fe/H] (thick black line) shows a clear decrease of [Fe/H] with distance to the galactic center. The thin black lines indicate the 1-σ uncertainty interval. Red symbols show the same trend from independent subsamples of ~ 30 stars and the red dashed line shows the best linear fit to this trend. The data are in reasonable agreement for a linear slope, for which we find best fitting parameters of −1.28 ± 0.25 dex/degree, corresponding to −0.50 ± 0.10 dex/kpc. Small, gray symbols show the actual distribution of star in our sample. Bottom: no significant radial age trend in our sample within the spatial coverage of our sample. When a linear function is fit to the data, we find a slope of −1.73 ± 1.96 Gyr/degree.
Current usage metrics show cumulative count of Article Views (full-text article views including HTML views, PDF and ePub downloads, according to the available data) and Abstracts Views on Vision4Press platform.
Data correspond to usage on the plateform after 2015. The current usage metrics is available 48-96 hours after online publication and is updated daily on week days.
Initial download of the metrics may take a while.