Fig. 12
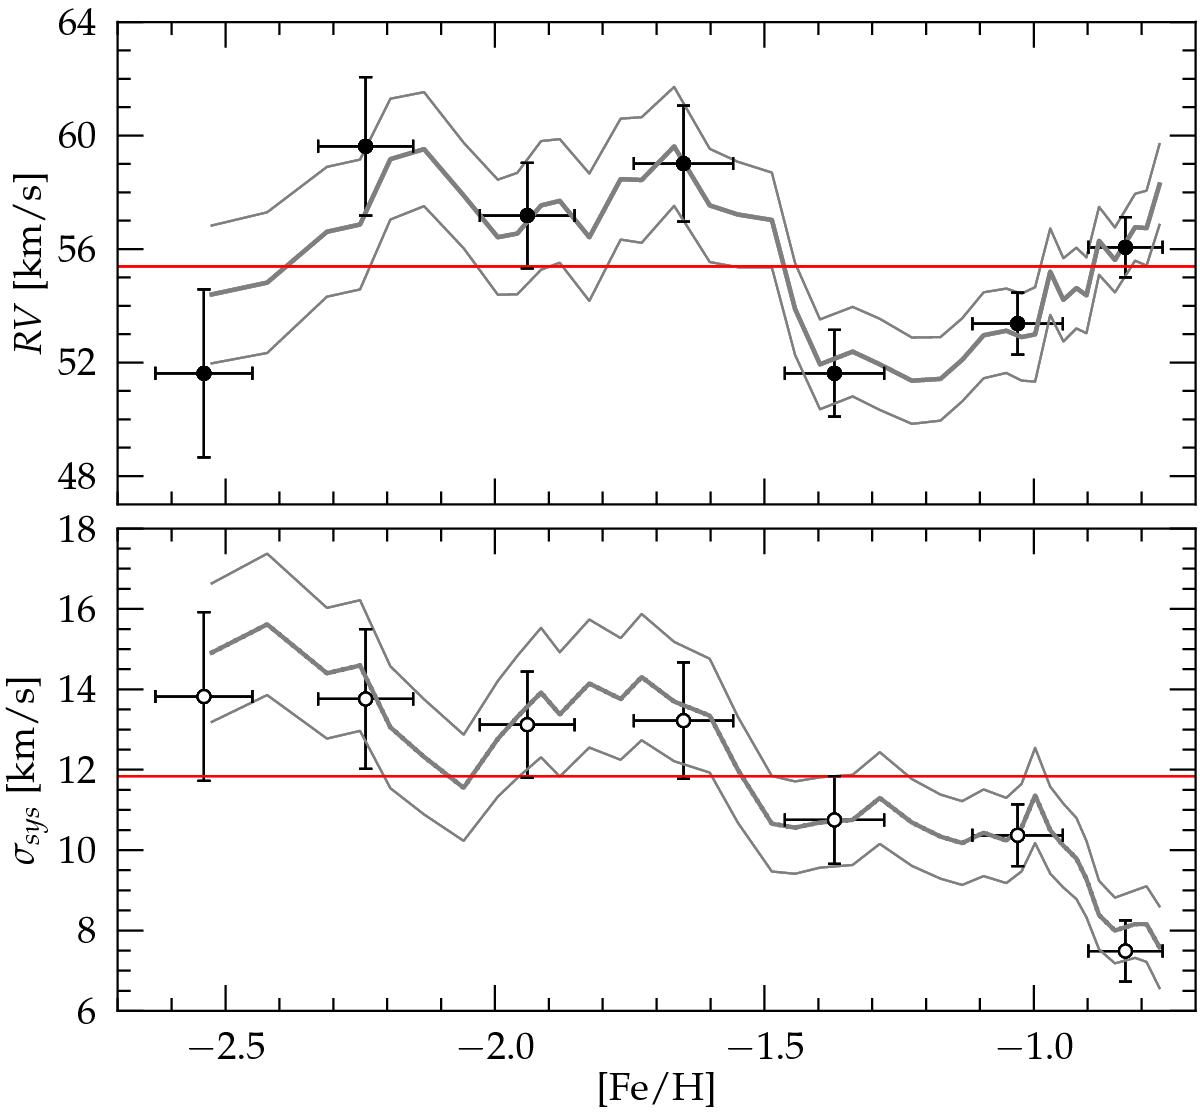
Top: radial velocities over the full range of [Fe/H] covered by our sample. The thick and thin solid lines represent the floating mean and the 1σ-uncertainty interval for subsamples of 80 stars. Measurements for seven independent metallicity intervals with 0.3 dex in size have been additionally taken and are shown as black dots. While the vertical error-bars indicate the intrinsic uncertainty for each bin, the horizontal bars represent the standard deviation of [Fe/H]-values in each bin. The red line marks the mean systemic RV for the whole sample. We do not observe a significant trend in RV with [Fe/H], but the data show signs that there exist different velocity subgroups. Bottom: same as in the top panel, for the velocity dispersion. A clear trend is visible with higher σsys towards lower [Fe/H].
Current usage metrics show cumulative count of Article Views (full-text article views including HTML views, PDF and ePub downloads, according to the available data) and Abstracts Views on Vision4Press platform.
Data correspond to usage on the plateform after 2015. The current usage metrics is available 48-96 hours after online publication and is updated daily on week days.
Initial download of the metrics may take a while.