Fig. 11
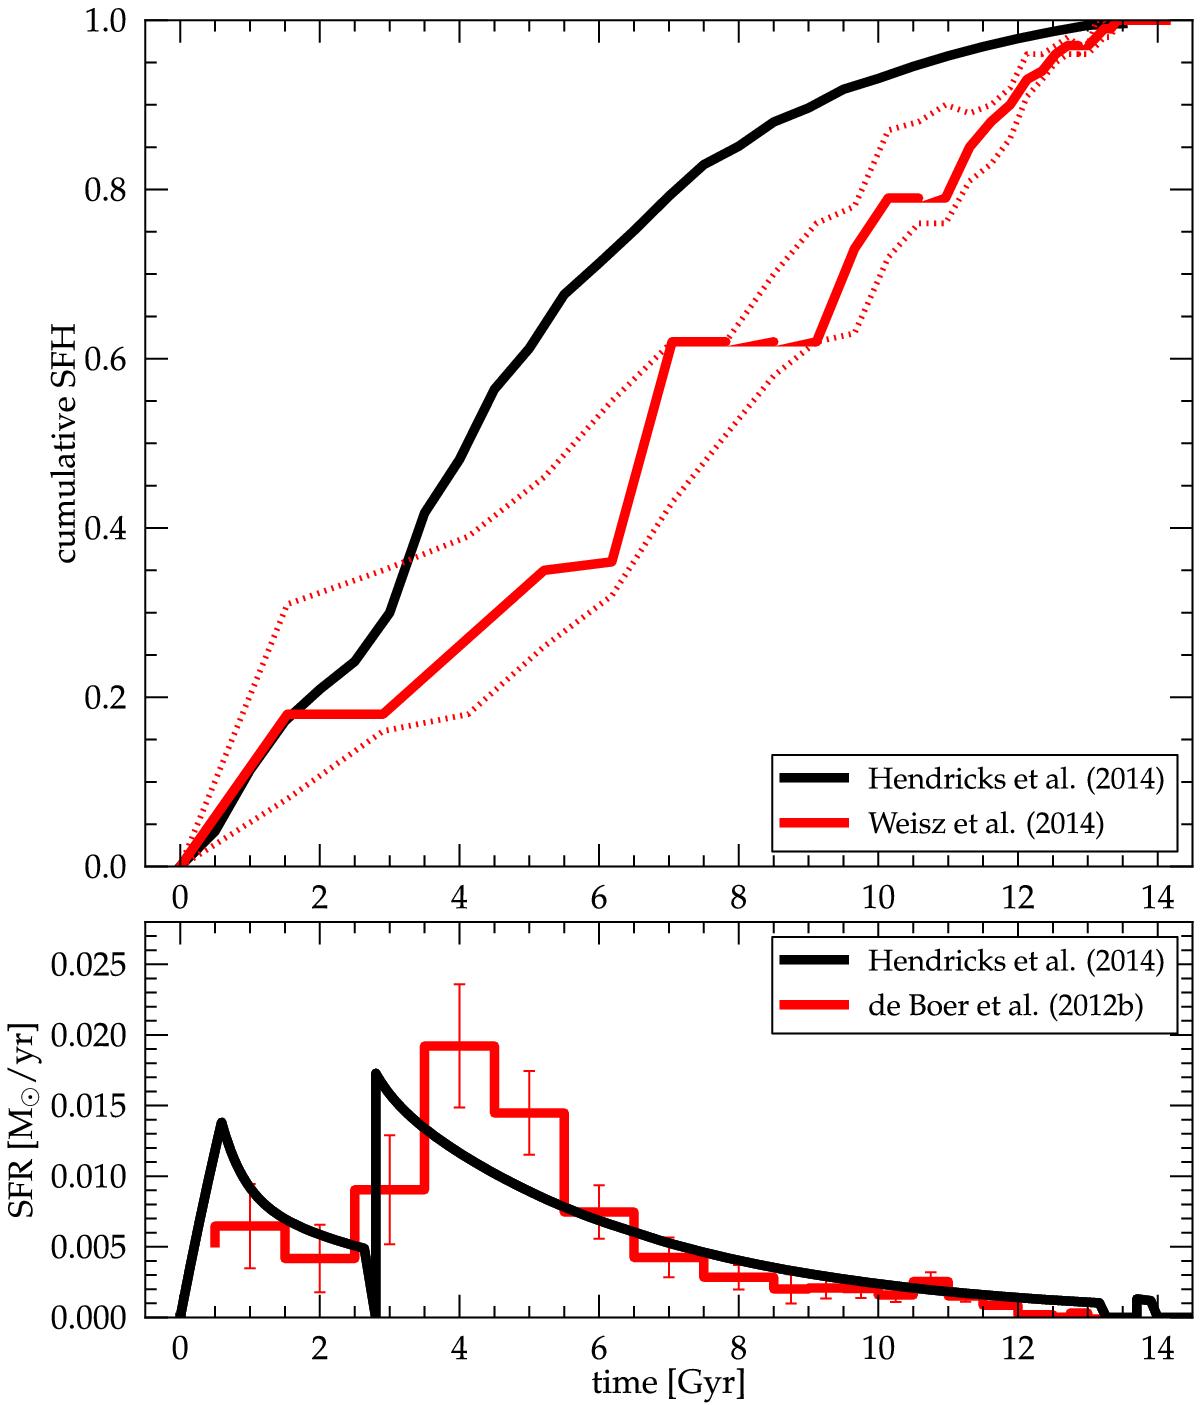
Top: comparison between the photometric SFH from Weisz et al. (2014; red solid line) and our proposed evolutionary scenario (black solid line) based on the chemical evolution for the α-elements, the MDF, and the observed AMR in the outer parts of Fornax. The red dotted lines show the uncertainty interval from the photometric SFH. The larger fraction of stars formed at early times as predicted by our model can be expected from a radial SF gradient (see text for details). Bottom: comparison between the photometric SFH from de Boer et al. (2012b) and our model. The photometric history represents the results obtained from the outermost radii which overlaps with our sample, rescaled to match the total number of stellar mass formed in our scenario.
Current usage metrics show cumulative count of Article Views (full-text article views including HTML views, PDF and ePub downloads, according to the available data) and Abstracts Views on Vision4Press platform.
Data correspond to usage on the plateform after 2015. The current usage metrics is available 48-96 hours after online publication and is updated daily on week days.
Initial download of the metrics may take a while.