Fig. 5
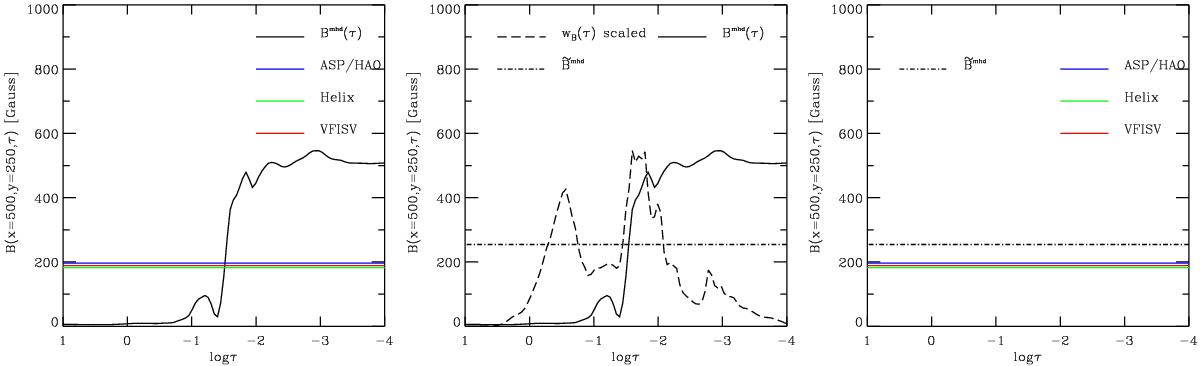
Left panel: original stratification of the magnetic field strength as a function of optical depth from the 3D MHD simulation Bmhd(τc) (solid-black line) for a particular point of the simulation domain (x = 500,y = 250; see Fig. 1). The color lines represent the results from the Milne-Eddington inversion of the Stokes profiles synthesized from the MHD simulation. Middle panel: here the solid-black is the same as on the left panel, Bmhd(τc); the dashed-black line represents the weighting function wB(τc) employed to calculated the weighted average ![]() (dashed-dotted black line) according to Eq. (6). Right panel: comparison between the weighted average value of the magnetic field
(dashed-dotted black line) according to Eq. (6). Right panel: comparison between the weighted average value of the magnetic field ![]() (dashed-dotted black line) from the numerical simulations with the magnetic field obtained from the M-E inversions (solid-color lines).
(dashed-dotted black line) from the numerical simulations with the magnetic field obtained from the M-E inversions (solid-color lines).
Current usage metrics show cumulative count of Article Views (full-text article views including HTML views, PDF and ePub downloads, according to the available data) and Abstracts Views on Vision4Press platform.
Data correspond to usage on the plateform after 2015. The current usage metrics is available 48-96 hours after online publication and is updated daily on week days.
Initial download of the metrics may take a while.