Fig. 2
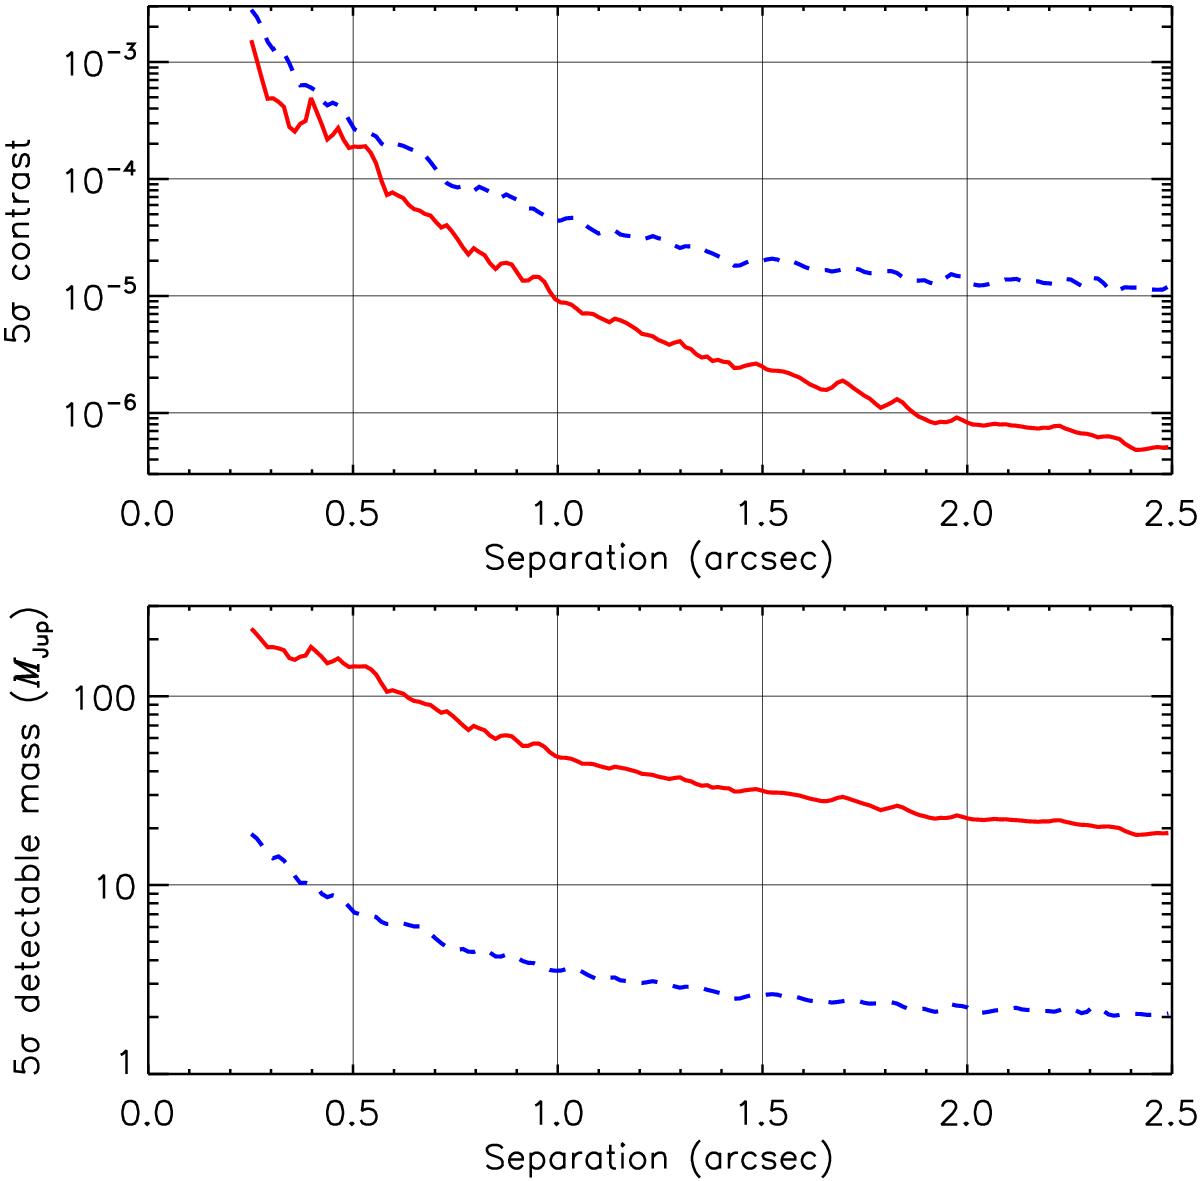
5σ contrast (top panel) and corresponding 5σ minimum detectable planet mass (bottom panel) for the LOCI ADI images from the two sample targets Alhena (red solid lines) and EM Cha (blue dashed lines). Both curves are corrected for the partial loss of planet flux due to self-subtraction in the data reduction. The total amount of field rotation captured was low in both observations (11.8° for Alhena and 12.6° for EM Cha); thus, the curves are conservative representations of the survey’s sensitivity. Note that Alhena provides higher contrast than EM Cha since it is a brighter star and therefore offers more dynamic range between the stellar peak flux and the background sensitivity limit. On the other hand, since EM Cha is a much younger system than Alhena (8 Myr vs. 300 Myr), the minimum detectable companion masses are lower for EM Cha by an order of magnitude.
Current usage metrics show cumulative count of Article Views (full-text article views including HTML views, PDF and ePub downloads, according to the available data) and Abstracts Views on Vision4Press platform.
Data correspond to usage on the plateform after 2015. The current usage metrics is available 48-96 hours after online publication and is updated daily on week days.
Initial download of the metrics may take a while.