Fig. 1
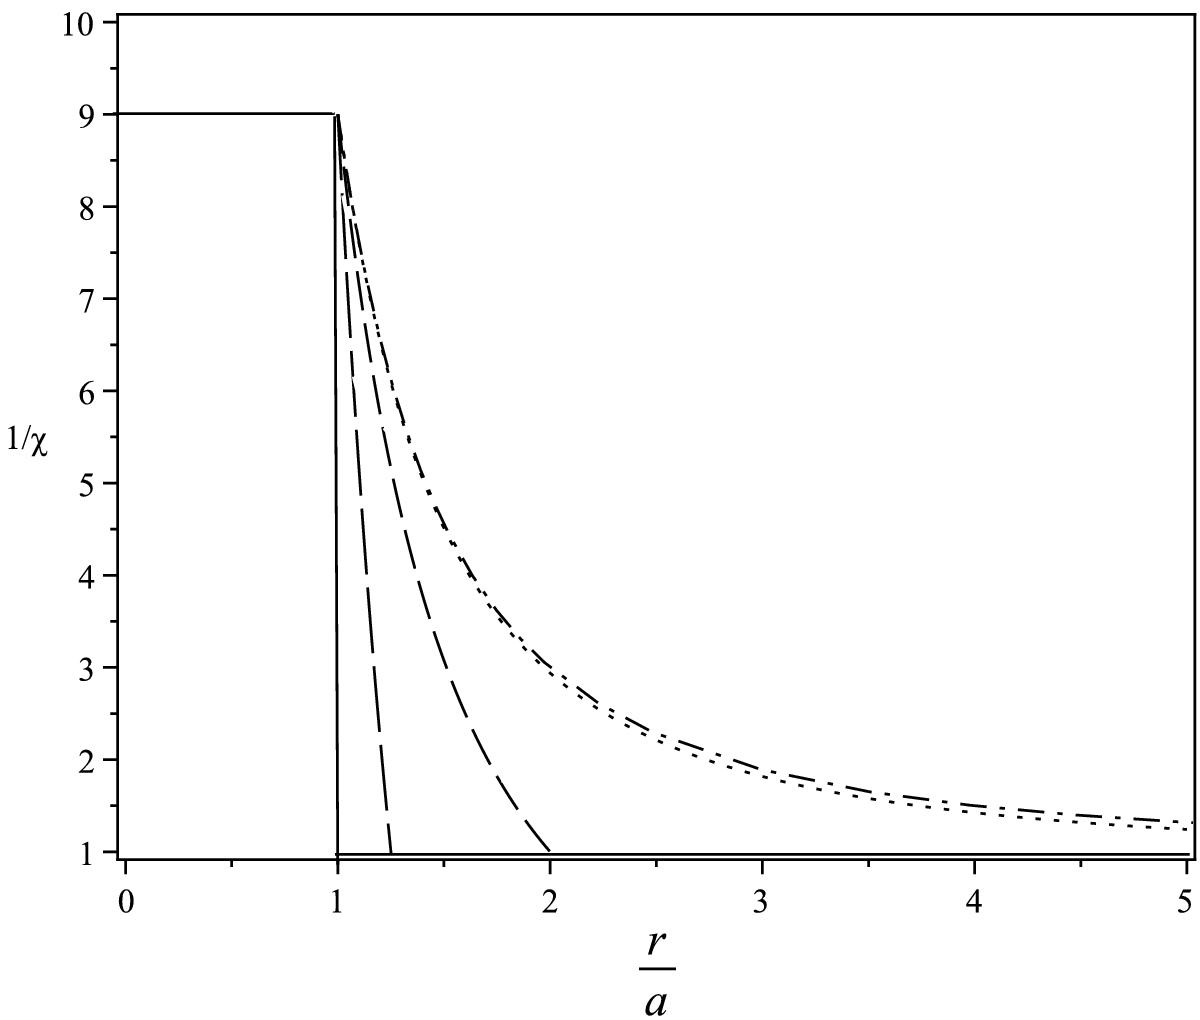
Radial profiles of the density in the considered loop model for density contrast χ = 1/9 and different values of the cord-shell radii ratio. The solid, long dashed, dashed, dotted, and dot-dashed curves correspond to the values of a/R = 1, 0.8, 0.5, 0.1, and 0.01, respectively. The vertical axis denotes the value 1 /χ = ρi/ρe. The radial distance is normalized to the cord radius a.
Current usage metrics show cumulative count of Article Views (full-text article views including HTML views, PDF and ePub downloads, according to the available data) and Abstracts Views on Vision4Press platform.
Data correspond to usage on the plateform after 2015. The current usage metrics is available 48-96 hours after online publication and is updated daily on week days.
Initial download of the metrics may take a while.