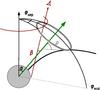
Fig. 8
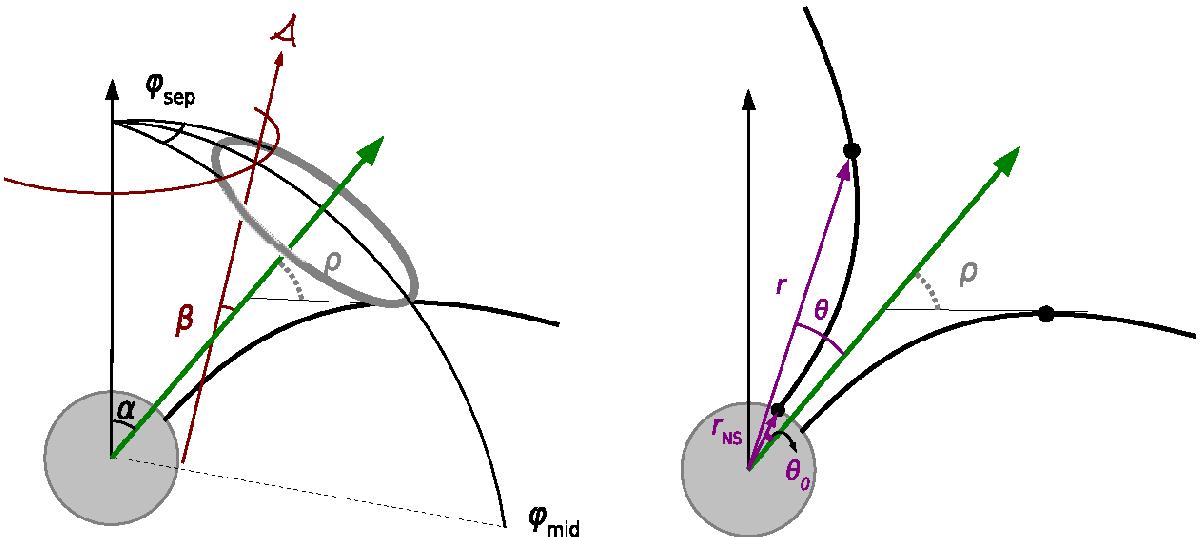
Left: a toy model of the pulsar magnetosphere. The pulsar’s spin axis is vertical and the magnetic axis is inclined by the angle α. An example dipolar field line is shown by the thick black line. The position of the LOS vector (red in the online version) stays fixed in space while the pulsar rotates around its spin axis. The plot shows the moment when spin, magnetic and LOS vectors are lying in the same plane (the fiducial plane). At this moment the angle between observer and magnetic axis is β. Usually β is measured clockwise from the magnetic axis, so for the vectors here the value of β is negative. Here we assume that emission comes from a cone at fixed height above the pulsar surface (with respect to the magnetic axis). The opening angle of the cone is marked with a thick dotted gray line. All angles in this plot are identical to the ones in Lorimer & Kramer (2005, Fig. 3.4a). However, in order to make the relationship between the angles more clear, in their figure β and ρ are plotted as originating from the centre of the star. Such transformation does not affect Eq. (6), since w (φsep in our plot) stays the same for both cases. Right: relationship between the opening angle of the emission cone ρ and coordinates of the emitting point (r,θ).
Current usage metrics show cumulative count of Article Views (full-text article views including HTML views, PDF and ePub downloads, according to the available data) and Abstracts Views on Vision4Press platform.
Data correspond to usage on the plateform after 2015. The current usage metrics is available 48-96 hours after online publication and is updated daily on week days.
Initial download of the metrics may take a while.