Fig. 7
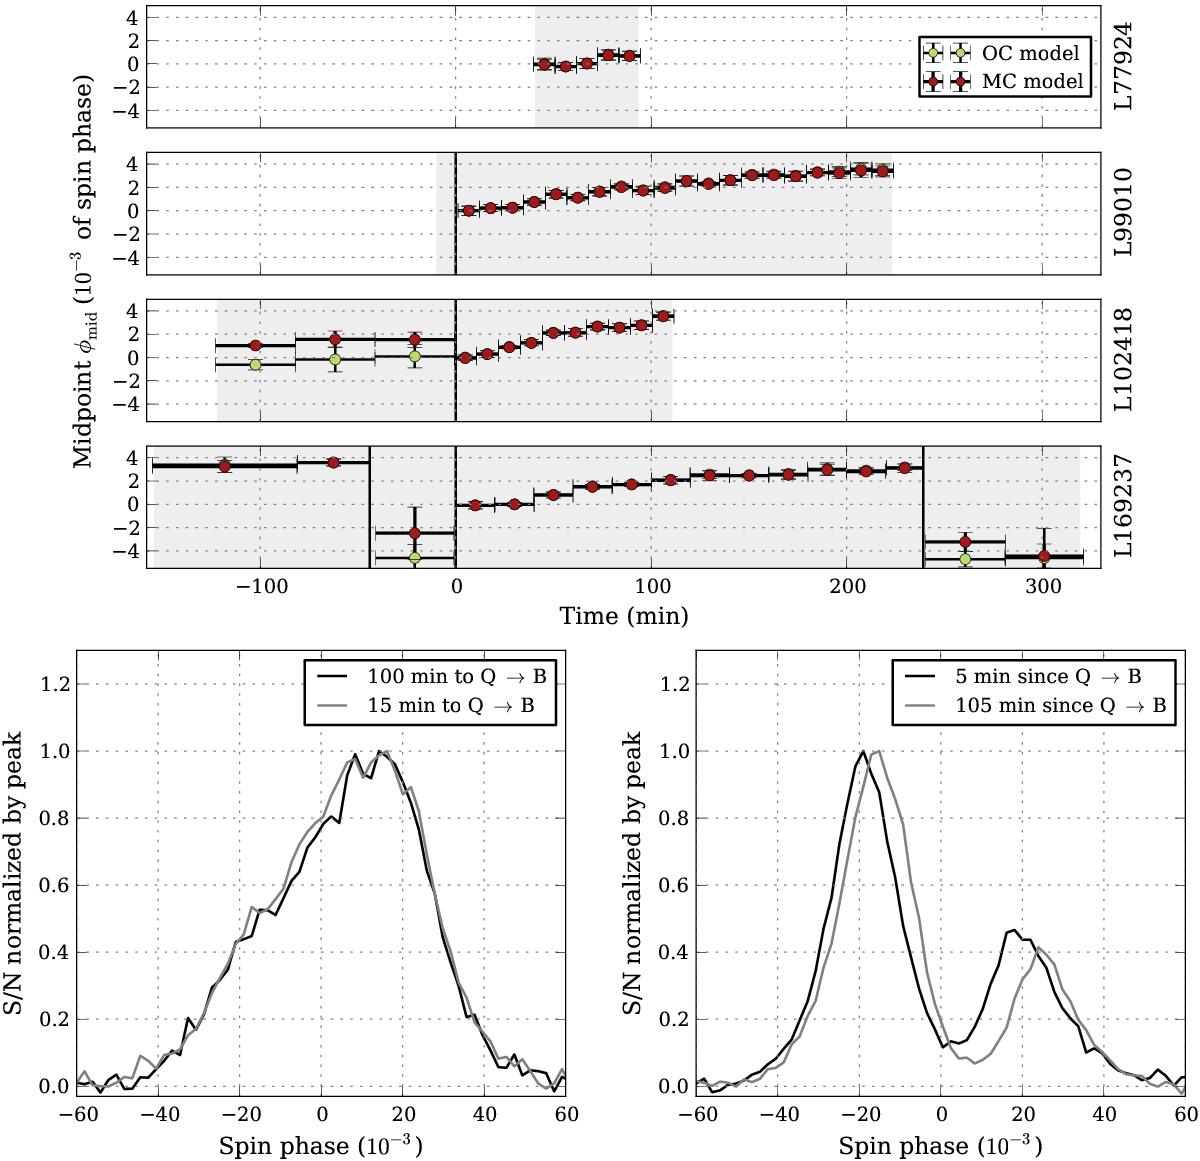
Top: midpoint between profile components versus time for all LBA observing sessions. Bottom, from left to right: two average profiles of the Q-mode (at the start of observations and just before the mode transition) and the B-mode (right after mode transition and at the end of the observation). This is observing session L102418 and the profiles from Q-mode correspond to the first and third points on the upper plot. For B-mode, the profiles are from the first and last point of B-mode at the same subplot of the upper plot. The timing residuals from the same observations are plotted in Fig. 2. Noticeably, in addition to changes in relative intensity of the components and their width, the profile in B-mode shifts as a whole towards later spin phase.
Current usage metrics show cumulative count of Article Views (full-text article views including HTML views, PDF and ePub downloads, according to the available data) and Abstracts Views on Vision4Press platform.
Data correspond to usage on the plateform after 2015. The current usage metrics is available 48-96 hours after online publication and is updated daily on week days.
Initial download of the metrics may take a while.