Fig. 6
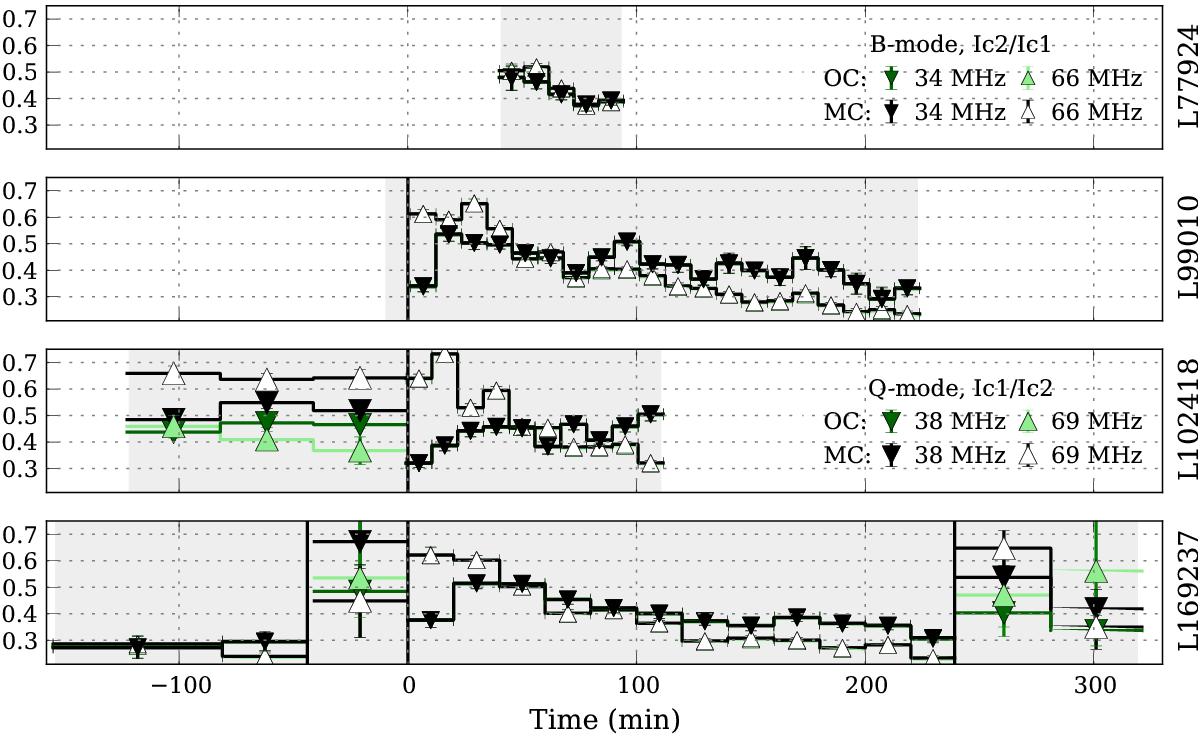
Ratio of component amplitudes versus frequency and time for all observing sessions. In order to be able to plot both modes on the same scale, we give Ic2/Ic1 for B-mode and the inverse quantity, Ic1/Ic2 for the Q-mode. For the B-mode, Ic2/Ic1 changes with time and this evolution is similar for every mode instance. This makes it possible to estimate the time since the start of the B-mode for L77924 (top row), although we did not directly record the transition in this observation. The vertical black lines mark the transitions between the modes.
Current usage metrics show cumulative count of Article Views (full-text article views including HTML views, PDF and ePub downloads, according to the available data) and Abstracts Views on Vision4Press platform.
Data correspond to usage on the plateform after 2015. The current usage metrics is available 48-96 hours after online publication and is updated daily on week days.
Initial download of the metrics may take a while.