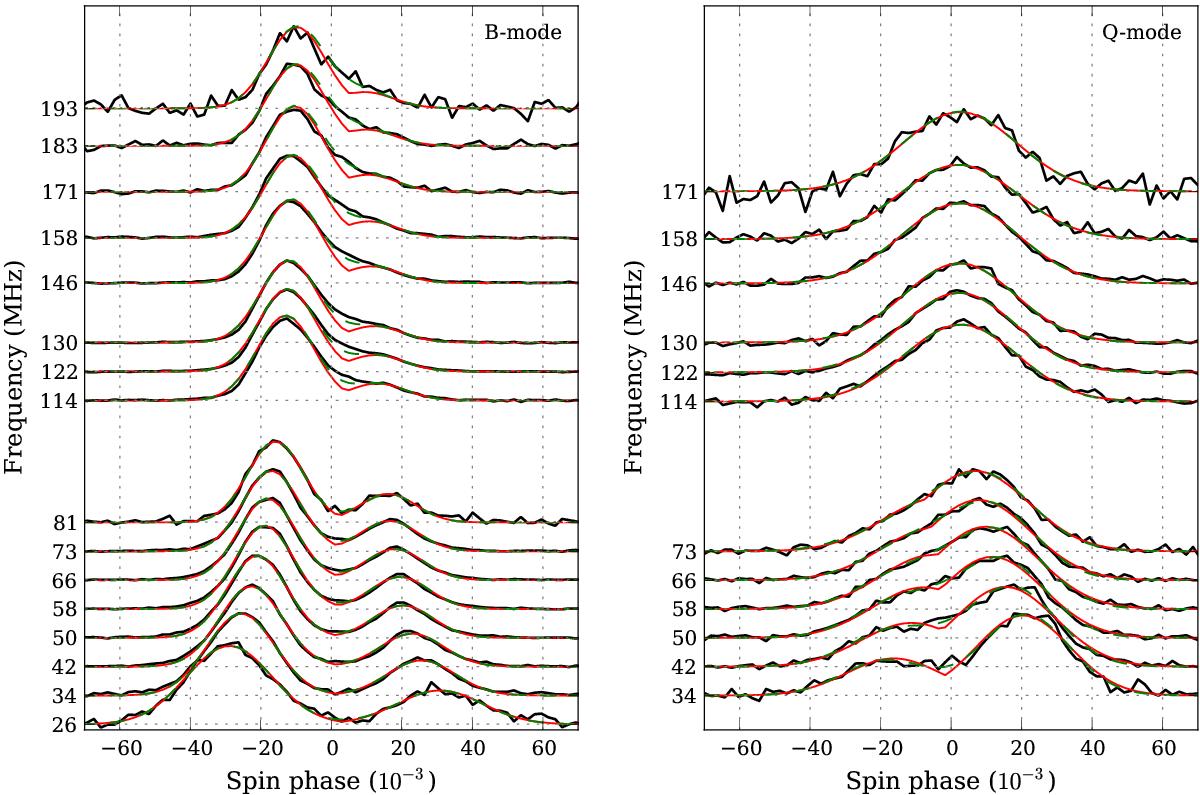
Fig. 4

Frequency evolution of the average profile in B and Q-mode from observations L102418 in LBA and L78450 in HBA. The dashed line (green in the online version) shows the fit from the OC model (overlapping Gaussians) and the gray line (red in online version) is the MC model (merging Gaussians). For the LBA data within each model, both B and Q-mode were fit with two independent Gaussian components. For the HBA data, the separation between components, their width and ratio of the peaks were extrapolated from the frequency dependence within the LBA band and only the midpoint between components and S/N of the leading component were fit. LBA and HBA observations are aligned with respect to the midpoint between components in the OC model.
Current usage metrics show cumulative count of Article Views (full-text article views including HTML views, PDF and ePub downloads, according to the available data) and Abstracts Views on Vision4Press platform.
Data correspond to usage on the plateform after 2015. The current usage metrics is available 48-96 hours after online publication and is updated daily on week days.
Initial download of the metrics may take a while.


