Fig. A.2
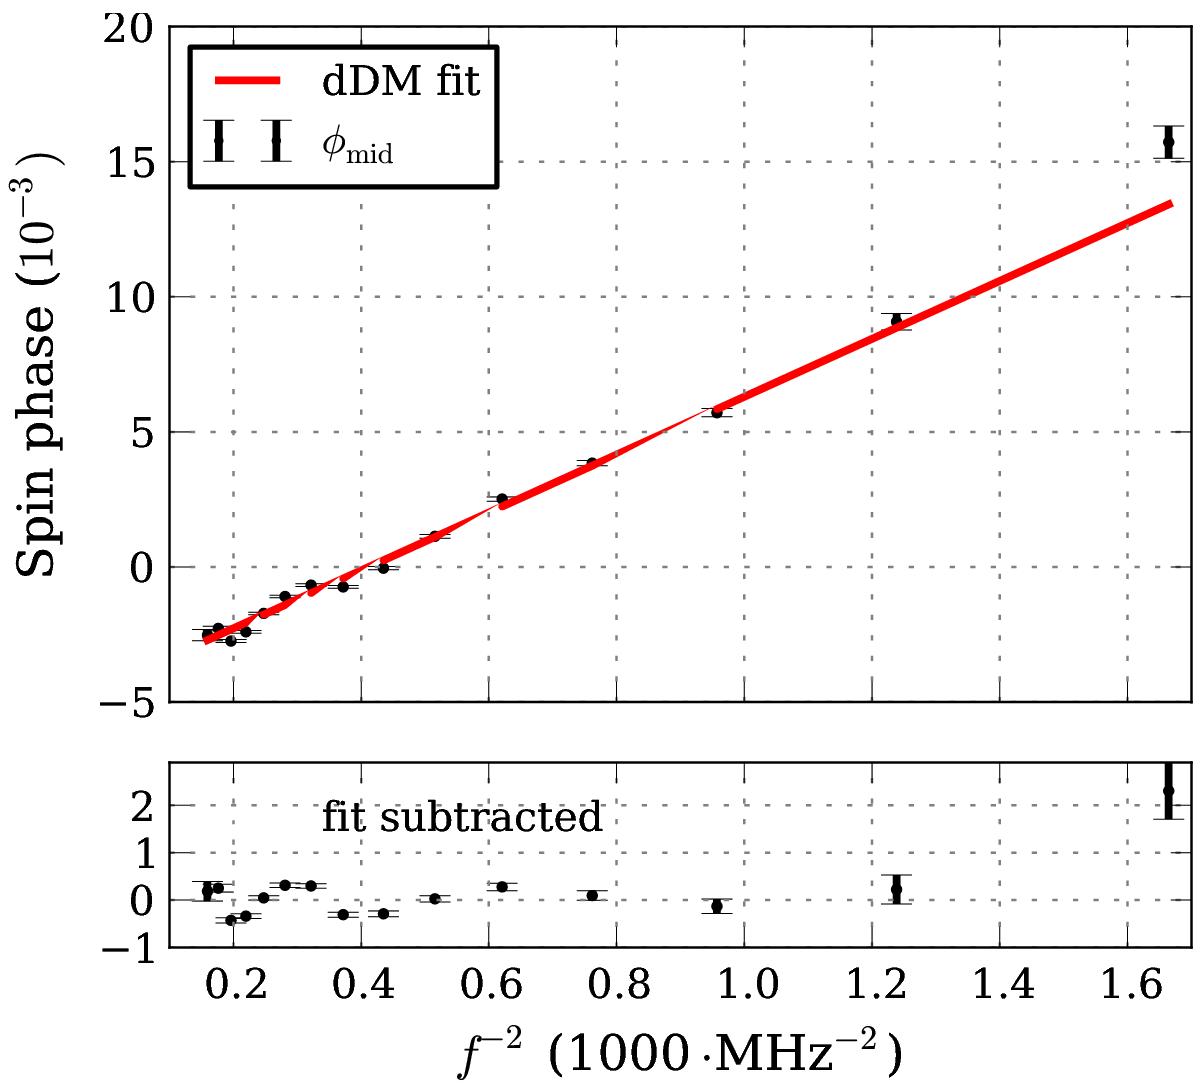
Midpoint between components, φmid = 0.5(φc1 + φc2) versus ν-2 for one LBA B-mode observation, which was folded with some trial DM value. The midpoint closely follows ~ ν-2 down to 25 MHz and that allows one to determine the correction to the trial DM. The extra lag at the lowest frequency of 24.5 MHz can be explained by scattering delay.
Current usage metrics show cumulative count of Article Views (full-text article views including HTML views, PDF and ePub downloads, according to the available data) and Abstracts Views on Vision4Press platform.
Data correspond to usage on the plateform after 2015. The current usage metrics is available 48-96 hours after online publication and is updated daily on week days.
Initial download of the metrics may take a while.