Fig. A.1
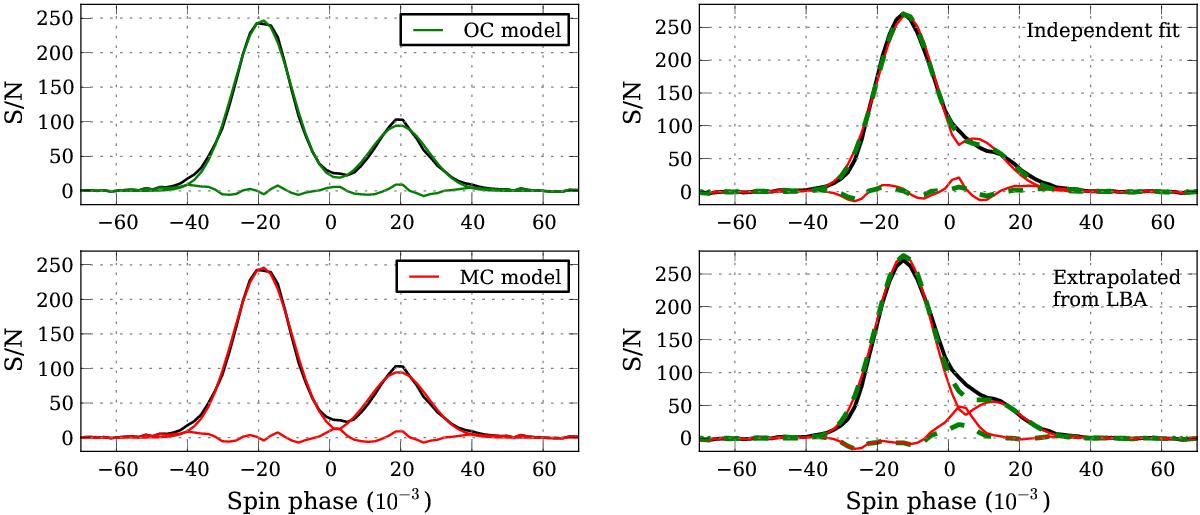
Left: an example high S/N average profile (B-mode, 2 hours of integration, 54−62 MHz), together with fit and residuals. The residuals show a small, but statistically significant discrepancy between the data and models. Right: two fits of HBA B-mode data. The upper subplot shows the LBA-like fit, with component positions, intensities and width being a priori unconstrained. On the lower subplot the FWHM, ratio of component peaks and their separation are extrapolated from the frequency dependence of corresponding LBA values. Only the midpoint, together with the S/N of the leading component, are fit. Neither of the fits and/or models describe the data perfectly and the fitted values from the unconstrained fit do not agree with fitted values extrapolated from LBA.
Current usage metrics show cumulative count of Article Views (full-text article views including HTML views, PDF and ePub downloads, according to the available data) and Abstracts Views on Vision4Press platform.
Data correspond to usage on the plateform after 2015. The current usage metrics is available 48-96 hours after online publication and is updated daily on week days.
Initial download of the metrics may take a while.