Fig. 1
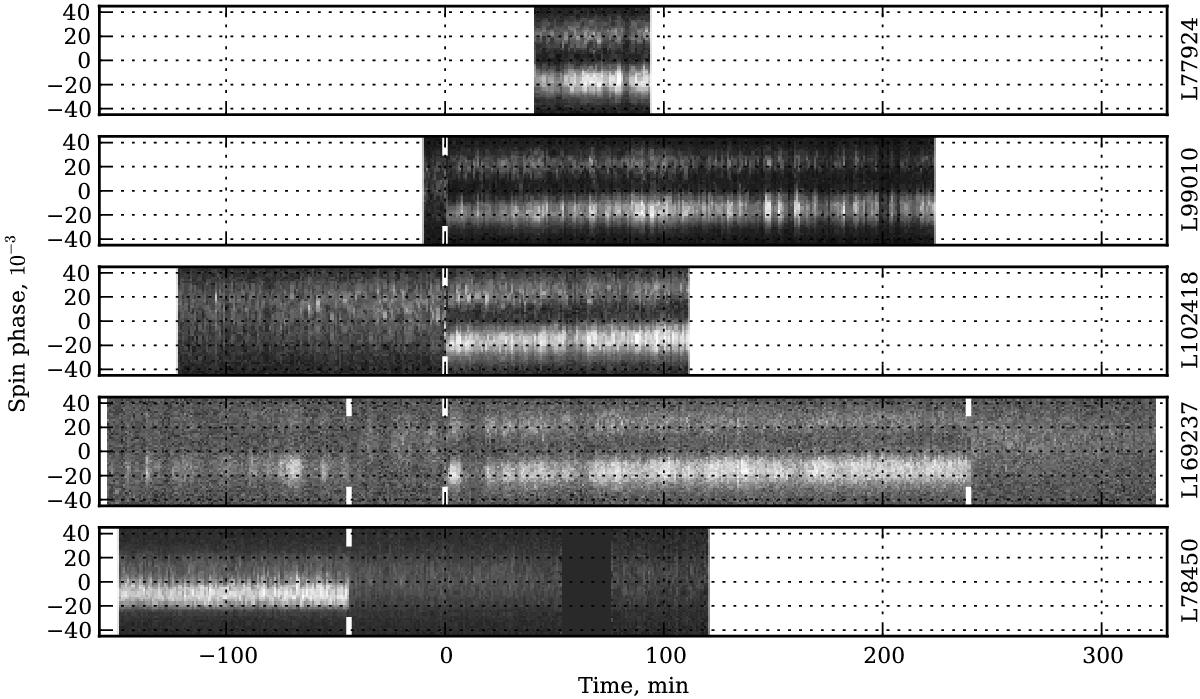
One-minute subintegrations versus rotational phase for five observing sessions. The top four panels show LBA (25−80 MHz) observations; the bottom one used the HBAs (110−190 MHz). Observation IDs are included on the right of each subplot. Mode transitions are marked with white ticks. Here and throughout the paper the three central LBA observations are aligned at the transition from Q-to-B, with the goal to facilitate visual comparison of time-dependent emission parameters. The B-mode of the observation L77924 was aligned relative to the others according to the ratio of component peak heights (see Fig. 6). The HBA observation was aligned by the Q-to-B transition in observation L169237. On the Y-axis, the pulsar’s zero spin phase was taken to match the midpoint between components at the start of the B-mode of that observation or at the beginning of the session if no Q-to-B transition was recorded. For L78450, the data from 60 to 80 minutes was cut out because of radio frequency interference (RFI).
Current usage metrics show cumulative count of Article Views (full-text article views including HTML views, PDF and ePub downloads, according to the available data) and Abstracts Views on Vision4Press platform.
Data correspond to usage on the plateform after 2015. The current usage metrics is available 48-96 hours after online publication and is updated daily on week days.
Initial download of the metrics may take a while.