Fig. 4
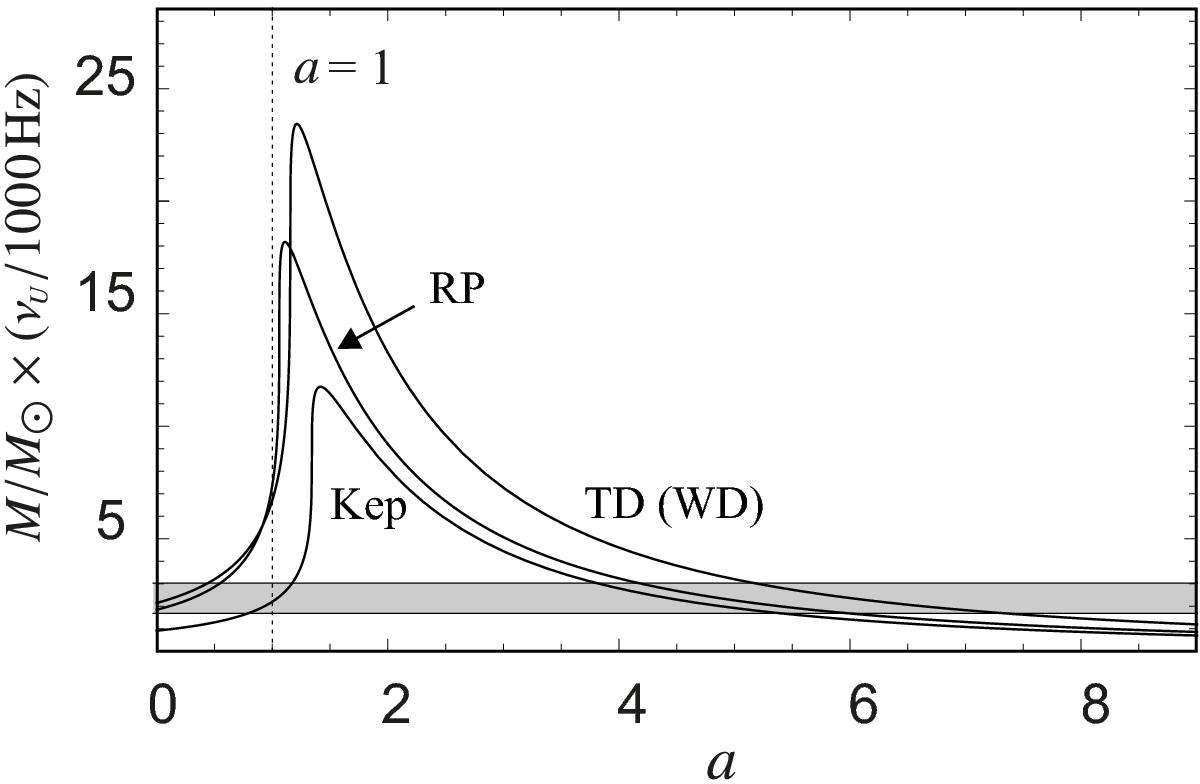
Behaviour of the M × νU(a) functions in the case of the RP, Kep, TD, and WD models. The shaded rectangular area denotes the observational bounds on the quantity M × νU(a) determined for GRS 1915+105 (Table 1). This area also roughly indicates the upper bounds for the whole group of the three microquasars GRS 1915+105, XTE J1550−564, and GRO J1655−40. Note that the curve corresponding to the TD model joins those that correspond to the WD model. The coincidence follows from the model frequency relations and the requirement of the observed 3:2 frequency ratio.
Current usage metrics show cumulative count of Article Views (full-text article views including HTML views, PDF and ePub downloads, according to the available data) and Abstracts Views on Vision4Press platform.
Data correspond to usage on the plateform after 2015. The current usage metrics is available 48-96 hours after online publication and is updated daily on week days.
Initial download of the metrics may take a while.