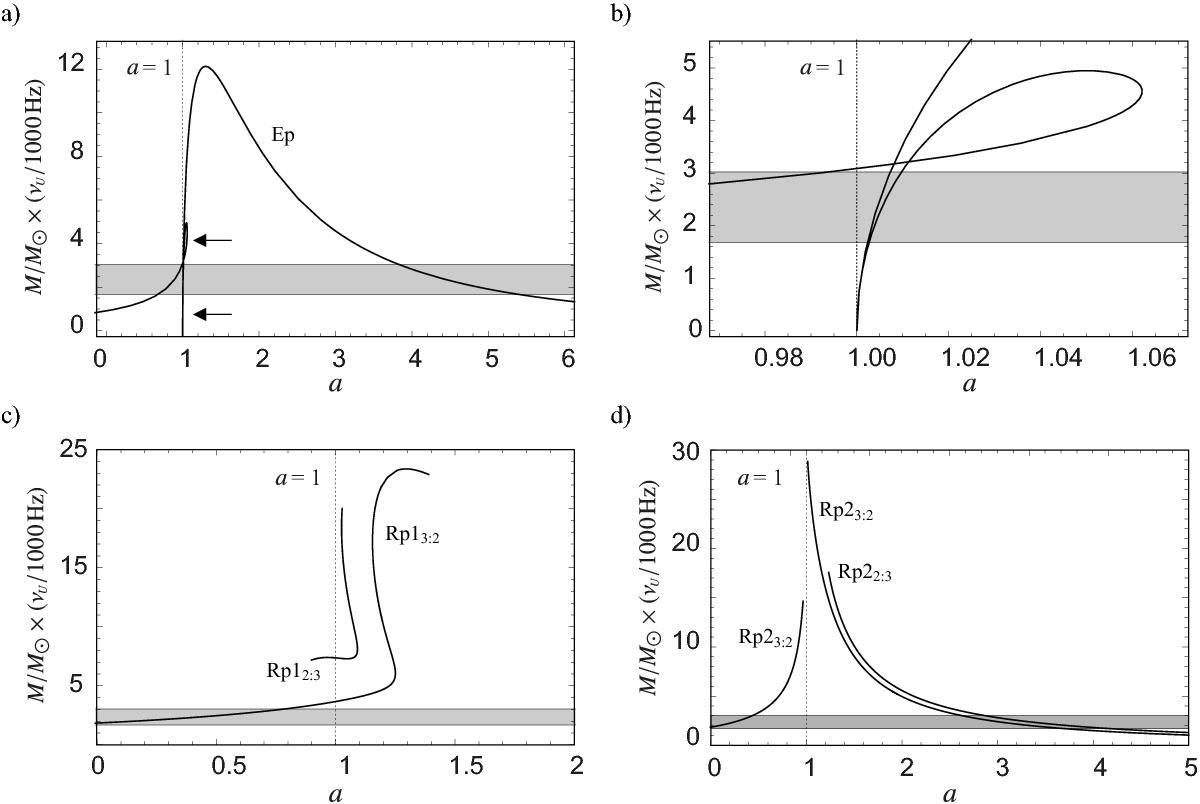
Fig. 3

Behaviour of the ambiguous M × νU(a) relations discussed in Sect. 3.1. The shaded rectangular area denotes the observational bounds on the quantity M × νU(a) determined for GRS 1915+105 (Table 1). This area also roughly indicates the upper bounds for the whole group of the three microquasars GRS 1915+105, XTE J1550−564 and GRO J1655−40. a) The M × νU(a) curves drawn for the Ep model. The two arrows indicate a region close to a = 1 where more than one resonant radii appear. b) An enlarged view of the curves drawn for the Ep model in the region close to a = 1. c) The M × νU(a) curves drawn for the RP1 model. Note the two branches of the curves and their full absence above a = 1.4. d) The M × νU(a) curves drawn for the RP2 model. Note the discontinuities in the displayed curves.
Current usage metrics show cumulative count of Article Views (full-text article views including HTML views, PDF and ePub downloads, according to the available data) and Abstracts Views on Vision4Press platform.
Data correspond to usage on the plateform after 2015. The current usage metrics is available 48-96 hours after online publication and is updated daily on week days.
Initial download of the metrics may take a while.


