Fig. 2
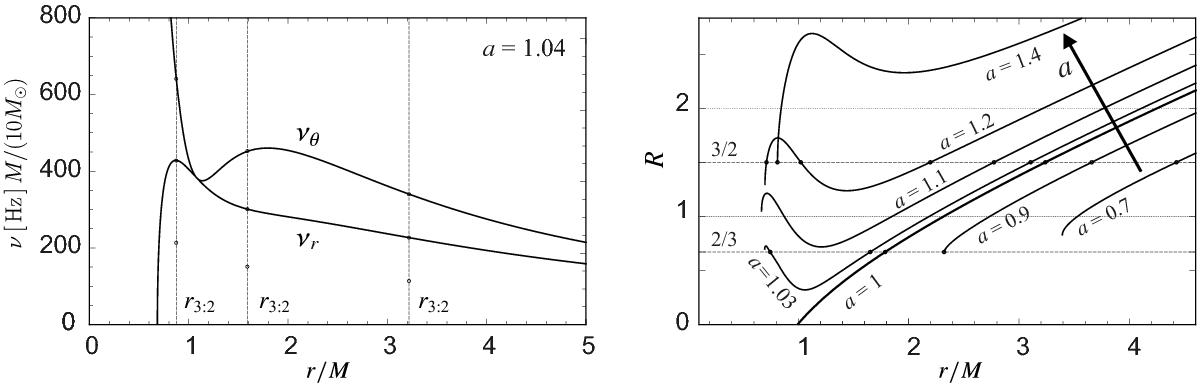
Left: behaviour of the epicyclic frequencies for a = 1.04. The three possible QPO excitation radii determined within the Ep model are denoted by the dotted vertical lines. We note that more than one extremum of the epicyclic frequencies related to accretion discs appear only when a ∈ (0.952, 1.089). Right: frequency ratio RRP1 determined within the RP1 model for various values of a. We note that the observed 3:2 ratio is not allowed by the model when a> 1.4.
Current usage metrics show cumulative count of Article Views (full-text article views including HTML views, PDF and ePub downloads, according to the available data) and Abstracts Views on Vision4Press platform.
Data correspond to usage on the plateform after 2015. The current usage metrics is available 48-96 hours after online publication and is updated daily on week days.
Initial download of the metrics may take a while.