Fig. 1
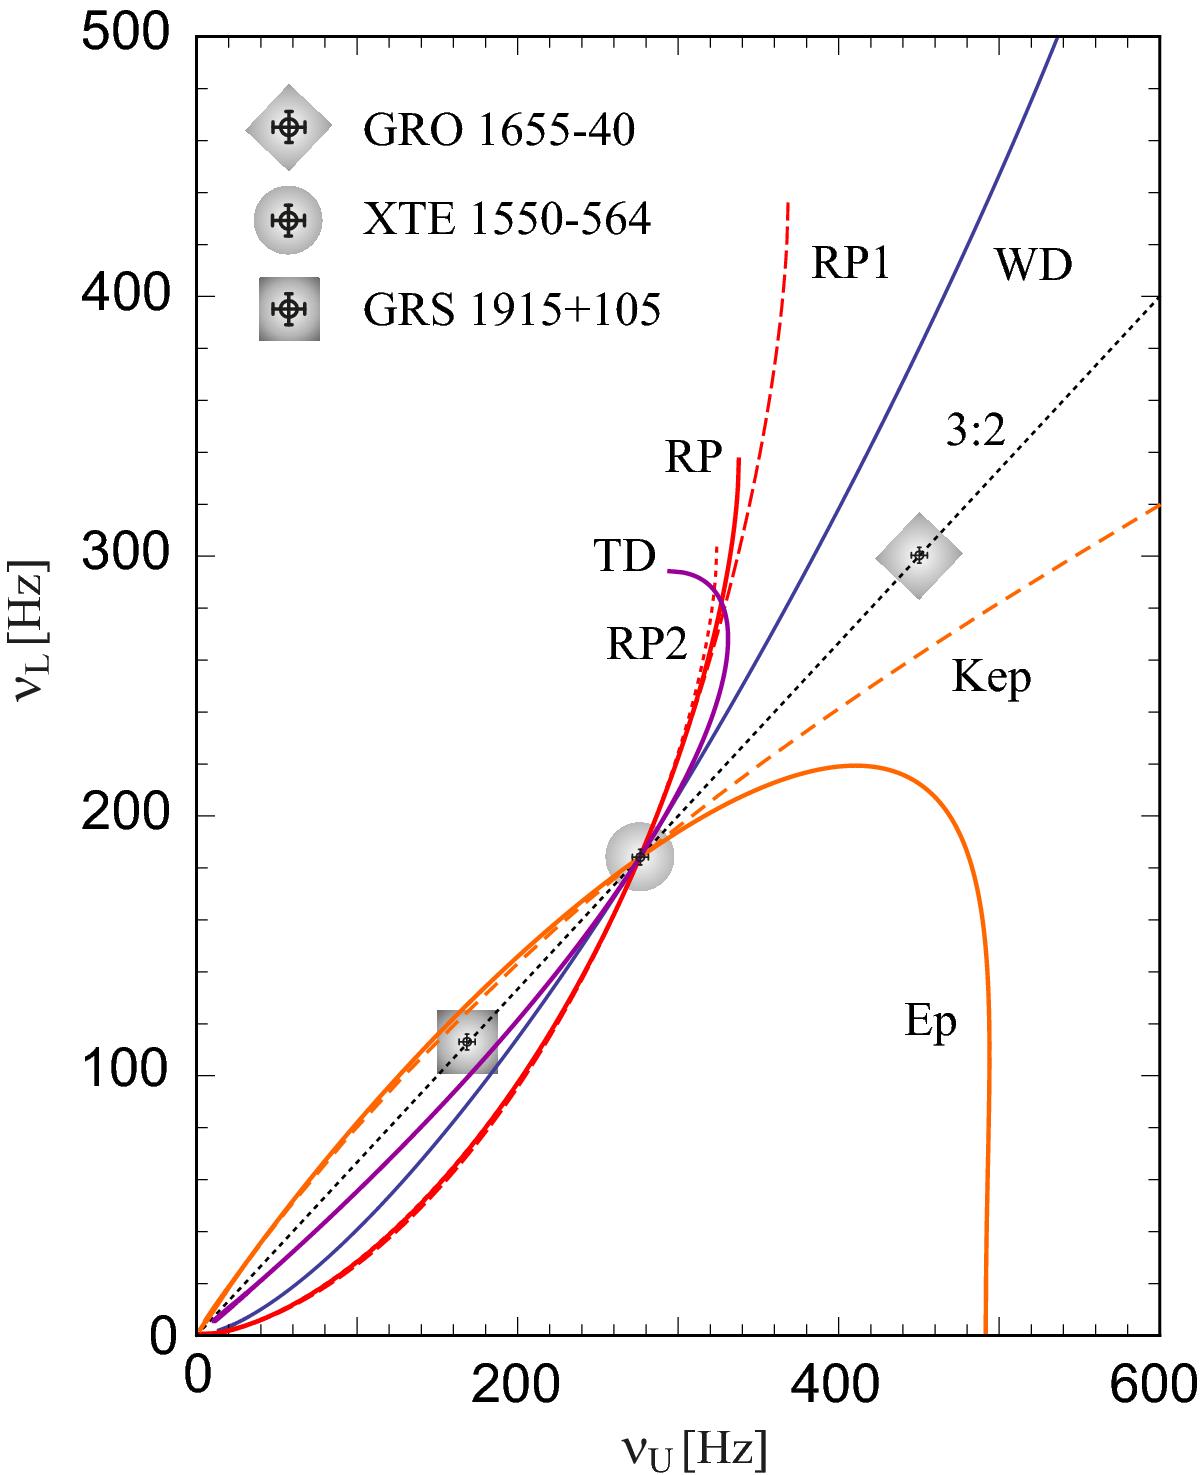
3:2 QPOs of the three microquasars and the particular frequency relations expected for the individual QPO models. The black dotted line denotes the 3:2 frequency ratio. The QPO frequencies and their error bars correspond to those specified in Table 1. All expected frequency relations are plotted for a common referential mass, M = 10 M⊙. The assumed values of spin then scale the curves such that they intersect with the 3:2 relation at frequencies exhibited by XTE 1550-564. Except for the Kep model, these spin values correspond to Kerr black holes, namely to a = 0.468 for the RP model, to a = 0.963 for the Ep model, to a = 0.339 for the TD and WD models, to a = 0.662 for the RP1 model, and to a = 0.372 for the RP2 model. For the Kep model, the chosen referential value of mass requires the spin a = 1.13, which exceeds the Kerr black hole limit.
Current usage metrics show cumulative count of Article Views (full-text article views including HTML views, PDF and ePub downloads, according to the available data) and Abstracts Views on Vision4Press platform.
Data correspond to usage on the plateform after 2015. The current usage metrics is available 48-96 hours after online publication and is updated daily on week days.
Initial download of the metrics may take a while.