Free Access
Fig. 7
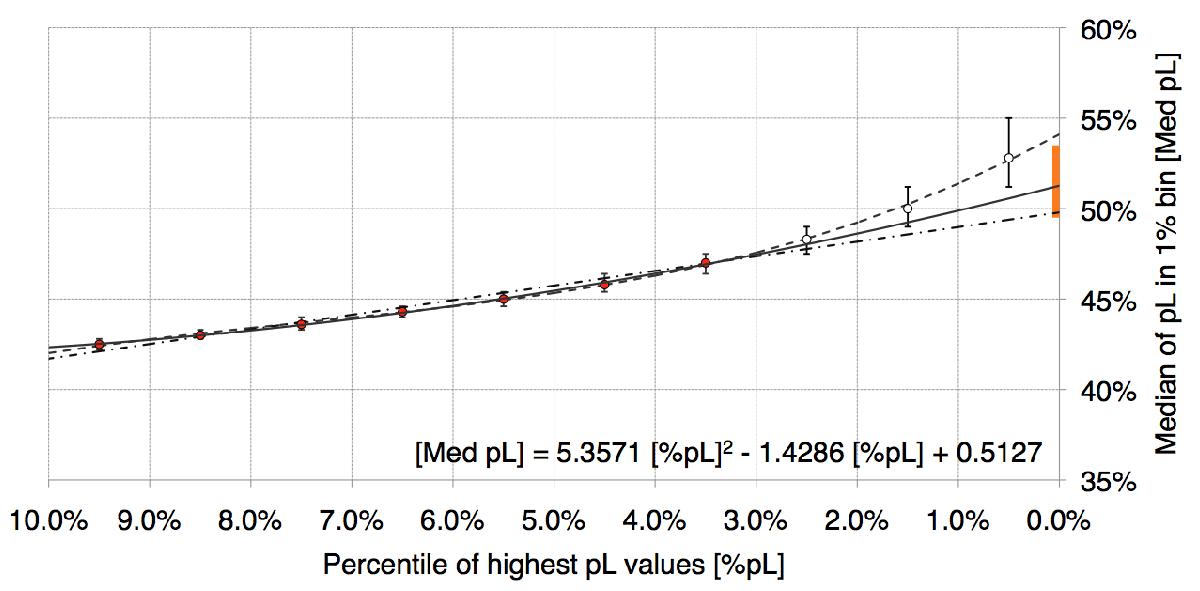
Median pL values observed in the nebula of RS Pup in 1% bins as a function of the percentile of highest values. The attached vertical segments show the full range of values of pL in each bin. The orange segment on the vertical axis shows the adopted uncertainty range for pmax = 51.5% ± 2.0%.
Current usage metrics show cumulative count of Article Views (full-text article views including HTML views, PDF and ePub downloads, according to the available data) and Abstracts Views on Vision4Press platform.
Data correspond to usage on the plateform after 2015. The current usage metrics is available 48-96 hours after online publication and is updated daily on week days.
Initial download of the metrics may take a while.