Fig. 3
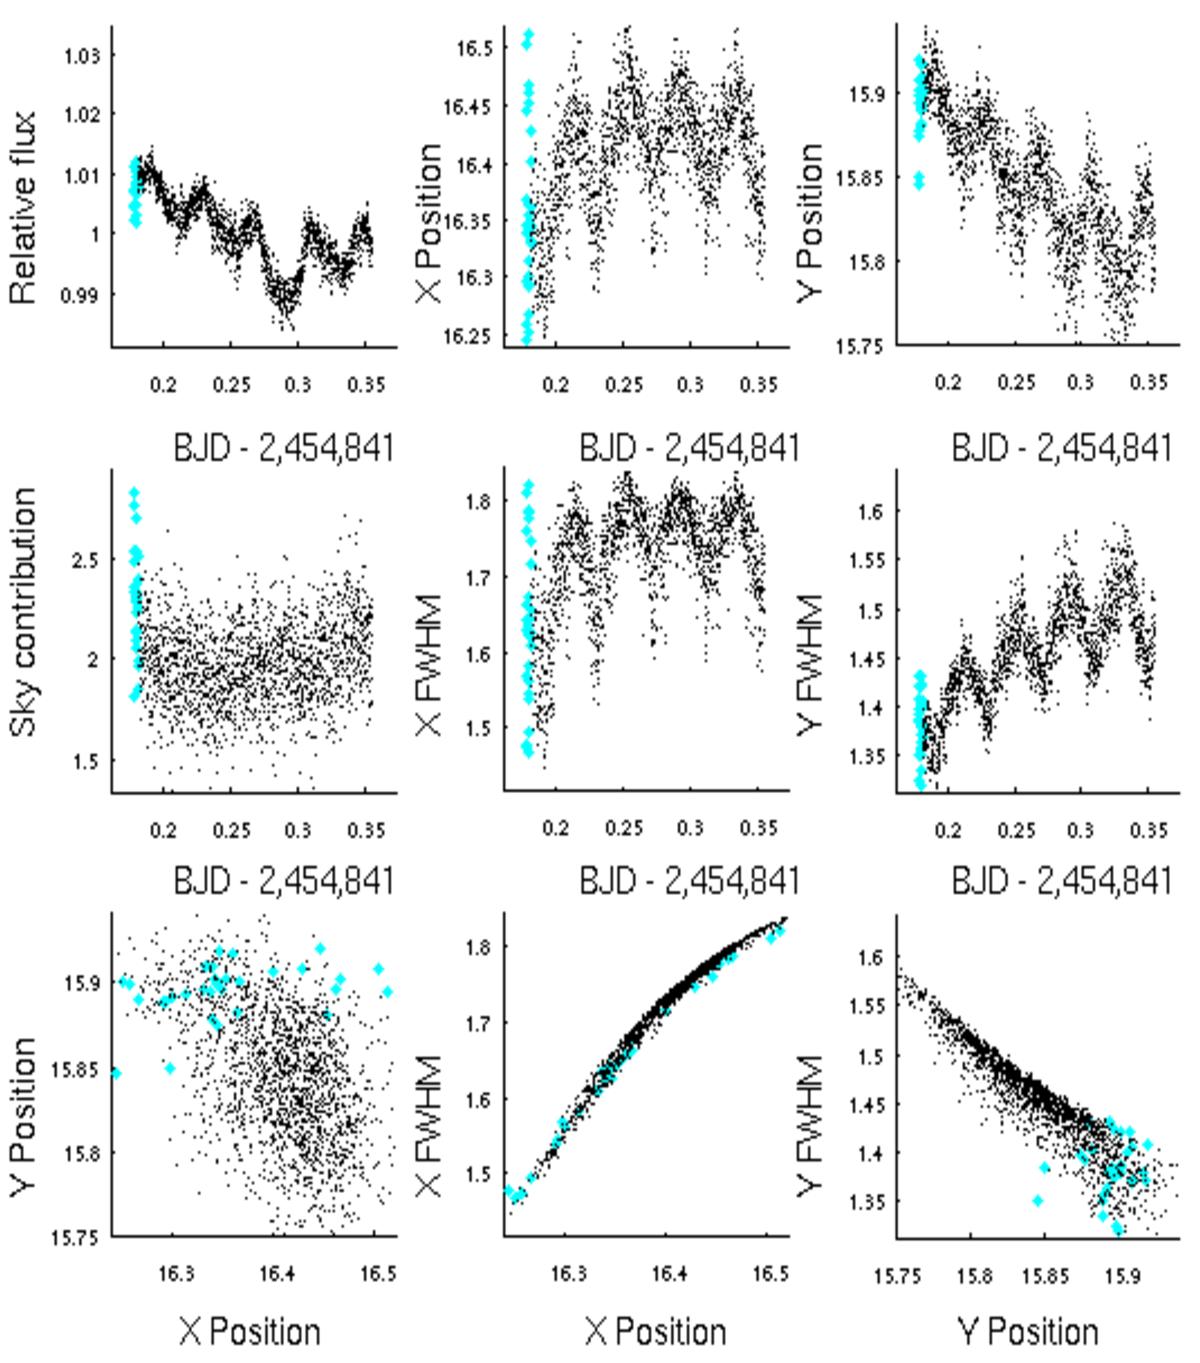
For illustration, evolution of the parameters measured by our reduction pipeline for a randomly chosen IRAC dataset (at 3.6 μm, 2009 January 9, AOR: 28894208). From top to bottom and left to right we display the evolutions of the normalised stellar fluxes, the PSF x- and y-centres, the background values, and the PSF FWHMs in the x- and y-directions. The last three panels display the correlation diagrams for several parameters, revealing a clear dependence on the FWHM with the position for both directions. The first values (thick cyan coloured dots) are rejected, as the measured parameters (e.g., sky contribution) are not yet stabilised.
Current usage metrics show cumulative count of Article Views (full-text article views including HTML views, PDF and ePub downloads, according to the available data) and Abstracts Views on Vision4Press platform.
Data correspond to usage on the plateform after 2015. The current usage metrics is available 48-96 hours after online publication and is updated daily on week days.
Initial download of the metrics may take a while.