Fig. 24
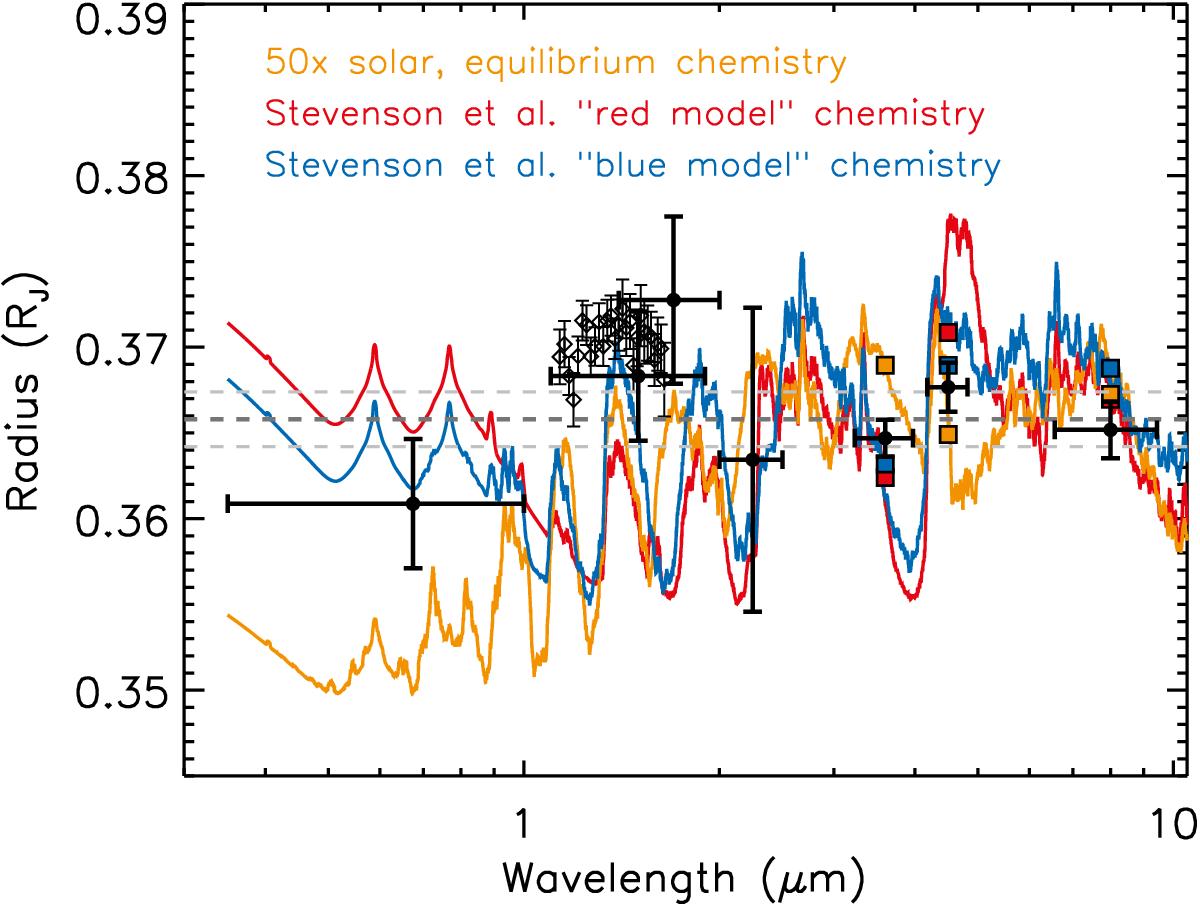
Model transit radius as function of wavelength compared with published transit depths and our Spitzer results. From left to right, the radii are derived from EPOXI (Ballard et al. 2010b), HST WFC3 (represented by empty diamonds with thinner error bars in the 1.14–1.65 μm wavelength range, Knutson et al. 2014), HST NICMOS (Pont et al. 2009), the H and K bands from the ground (Alonso et al. 2008; Cáceres et al. 2009), and IRAC (ours) studies. Three models are shown. In orange is the 50×-solar model from Fig. 22. In red and blue are transmission spectra taken from Shabram et al. (2011), who used mixing ratios suggested for the planetary dayside by S10. Band-average calculations are shown as squares for the three models, across the Spitzer bandpasses. The dramatic differences between the models at optical wavelength are only due to different assumptions about the abundances of alkali metals. The blue and red models, which have depleted CH4, and enhanced CO and CO2, are generally preferred.
Current usage metrics show cumulative count of Article Views (full-text article views including HTML views, PDF and ePub downloads, according to the available data) and Abstracts Views on Vision4Press platform.
Data correspond to usage on the plateform after 2015. The current usage metrics is available 48-96 hours after online publication and is updated daily on week days.
Initial download of the metrics may take a while.