Fig. 19
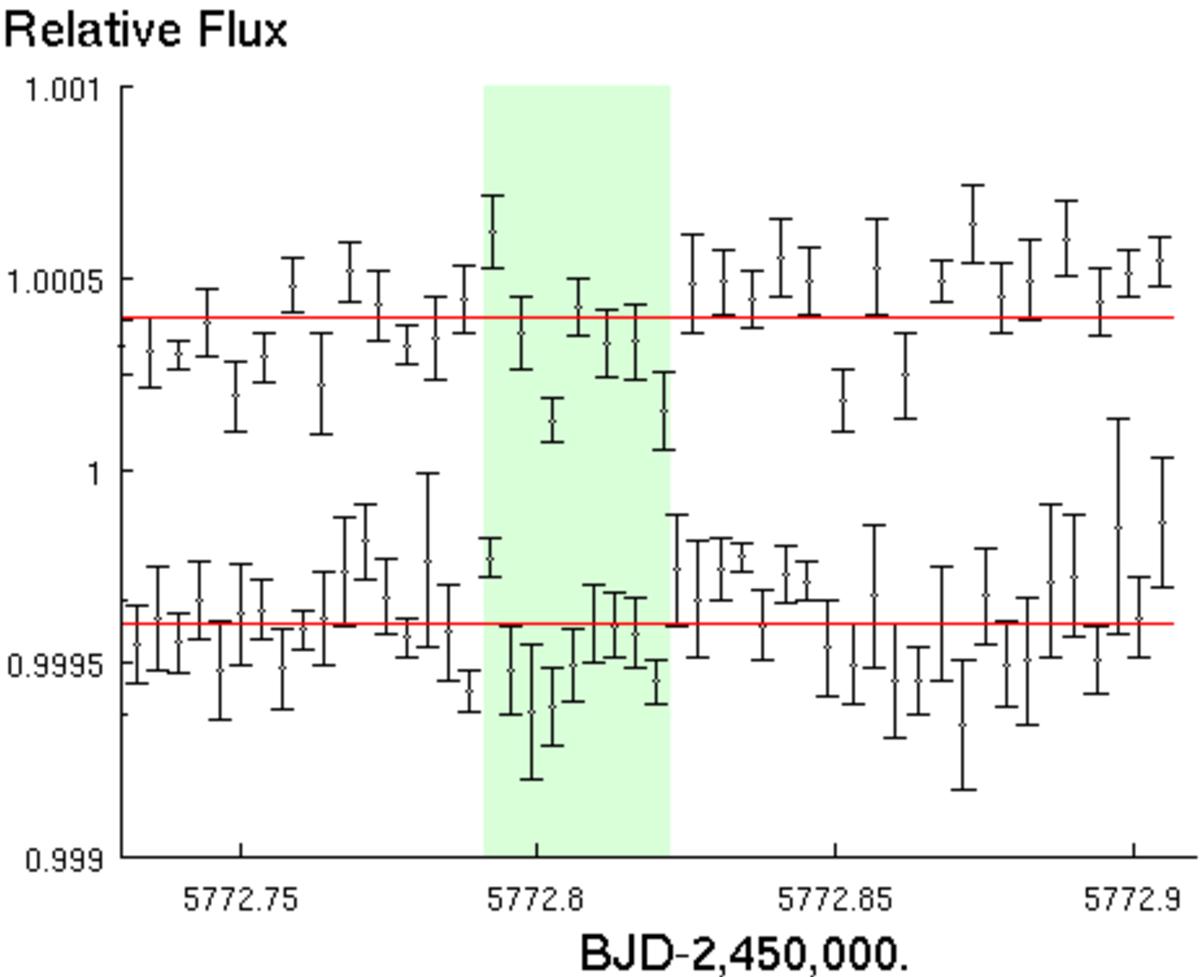
Same as Fig. 18 for the 2011 Jul 30 data (AOR: 42614016). The upper dataset is the result of aperture photometry with a 2D elliptical Gaussian centring and is corrected for all systematics minimising the BIC. The lower dataset is produced from a double 1D Gaussian fit of the computed x-FWHM and corrected in the same way. The shaded green area corresponds to UCF-1.01 transit event.
Current usage metrics show cumulative count of Article Views (full-text article views including HTML views, PDF and ePub downloads, according to the available data) and Abstracts Views on Vision4Press platform.
Data correspond to usage on the plateform after 2015. The current usage metrics is available 48-96 hours after online publication and is updated daily on week days.
Initial download of the metrics may take a while.